The X12 Procedure
- Overview
-
Getting Started

-
Syntax
 Functional Summary PROC X12 Statement ADJUST Statement ARIMA Statement AUTOMDL Statement BY Statement CHECK Statement ESTIMATE Statement EVENT Statement FORECAST Statement ID Statement IDENTIFY Statement INPUT Statement OUTLIER Statement OUTPUT Statement REGRESSION Statement TABLES Statement TRANSFORM Statement USERDEFINED Statement VAR Statement X11 Statement
 -
Details

-
Examples

- References
Example 37.9 Illustration of ODS Graphics
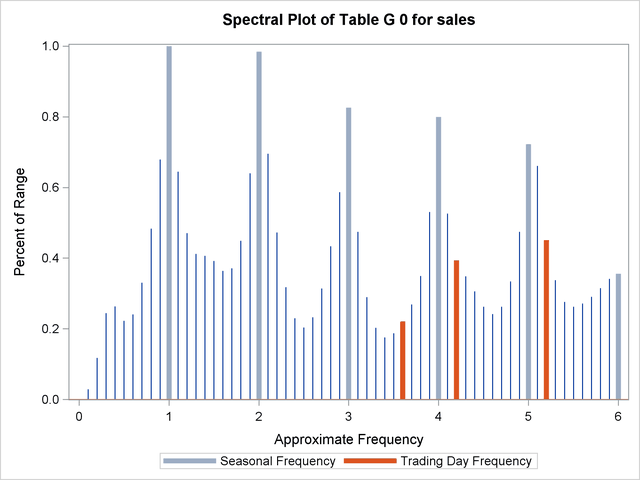
This example illustrates the use of ODS Graphics. Using the same data set as in the section Basic Seasonal Adjustment and the previous examples, a spectral plot of the original series is displayed in Output 37.9.1.
The graphical displays are available when ODS Graphics is enabled. For specific information about the graphics available in the X12 procedure, see the section ODS Graphics.
proc x12 data=sales date=date;
   var sales;
run;
Output 37.9.1
Spectral Plot for Original Data
