Develop Models Window
This resizable window provides access to all of the Forecasting System’s interactive model fitting and graphical tools. Use it to fit forecasting models to an individual time series and choose the best model to use to produce the final forecasts of the series. Invoke this window by using the Develop Models button on the Time Series Forecasting window.
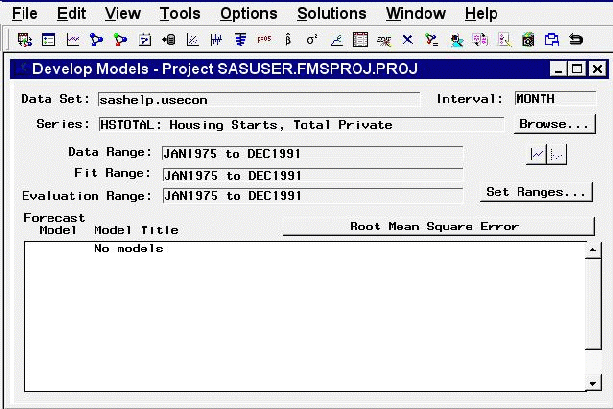
Controls and Fields
- Data Set
is the name of the current input data set.- Interval
is the time interval (data frequency) for the input data set.- Series
is the variable name and label of the current time series.- Browse button
opens the Series Selection window to enable you to change the current input data set or series.- Data Range
is the date of the first and last nonmissing data values available for the current series in the input data set.- Fit Range
is the current period of fit setting. This is the range of data that will be used to fit models to the series.- Evaluation Range
is the current period of evaluation setting. This is the range of data that will be used to calculate the goodness-of-fit statistics for models fit to the series.- Set Ranges button
opens the Time Ranges Specification window to enable you to change the fit range or evaluation range. Note: A new fit range is applied when new models are fit or when existing models are refit. A new evaluation range is applied when new models are fit or when existing models are refit or reevaluated. Changing the ranges does not automatically refit or reevaluate any models in the table: Use the Refit Models or Reevaluate Models items under the Edit menu.- View Series Graphically icon
opens the Time Series Viewer window to display plots of the current series.- View Selected Model Graphically icon
opens the Model Viewer to display graphs and tables for the currently highlighted model.- Forecast Model
is the column of the model table that contains check boxes to select which model is used to produce the final forecasts for the current series.- Model Title
is the column of the model table that contains the descriptive labels of the forecasting models fit to the current series.- Root Mean Square Error (or other statistic name) button
is the button above the right side of the table. It displays the name of the current model selection criterion: a statistic that measures how well each model in the table fits the values of the current series for observations within the evaluation range. Clicking this button opens the Model Selection Criterion window to let you to select a different statistic. When you select a statistic, the model table the Develop Models window is updated to show current values of that statistic.
Menu Bar
- File
-
- New Project
opens a dialog that lets you create a new project, assign it a name and description, and make it the active project.- Open Project
opens a dialog that lets you select and load a previously saved project.- Save Project
saves the current state of the system (including all the models fit to a series) to the current project catalog entry.- Save Project as
saves the current state of the system with a prompt for the name of the catalog entry in which to store the information.- Clear Project
clears the system, deleting all the models for all series.- Save Forecast
writes forecasts from the currently highlighted model to an output data set.- Save Forecast As
prompts for an output data set name and saves the forecasts from the currently highlighted model.- Output Forecast Data Set
opens a dialog for specifying the default data set used when you select "Save Forecast."- Import Data
is available if you license SAS/Access software. It opens an Import Wizard, which you can use to import your data from an external spreadsheet or data base to a SAS data set for use in the Time Series Forecasting System.- Export Data
is available if you license SAS/Access software. It opens an Export Wizard, which you can use to export a SAS data set, such as a forecast data set created with the Time Series Forecasting System, to an external spreadsheet or data base.- Print Setup
opens the Print Setup window, which enables you to access your operating system print setup.- Close
closes the Develop Models window and returns to the main window.
- Edit
-
- Fit Model
-
- Automatic Fit
invokes the automatic model selection process.- Select From List
opens the Models to Fit window.- Smoothing Model
opens the Smoothing Model Specification window.- ARIMA Model
opens the ARIMA Model Specification window.- Custom Model
opens the Custom Model Specification window.- Combine Forecasts
opens the Forecast Combination Model Specification window.- External Forecasts
opens the External Forecast Model Specification window.
- Edit Model
enables you to modify the specification of the currently highlighted model in the table and fit the modified model. The new model replaces the current model in the table.- Delete Model
deletes the currently highlighted model from the model table.- Refit Models
-
- All Models
refits all models in the table by using data within the current fit range.- Selected Model
refits the currently highlighted model by using data within the current fit range.
- Reevaluate Models
-
- All Models
recomputes statistics of fit for all models in the table by using data within the current evaluation range.- Selected Model
recomputes statistics of fit for the currently highlighted model by using data within the current evaluation range.
- View
-
- Project
opens the Manage Forecasting Project window.- Data Set
opens a Viewtable window to display the current input data set.- Series
opens the Time Series Viewer window to display plots of the current series. This is the same as the View Series Graphically icon.- Model Predictions
opens the Model Viewer to display a predicted versus actual plot for the currently highlighted model. This is the same as the View Selected Model Graphically icon.- Prediction Errors
opens the Model Viewer to display the prediction errors for the currently highlighted model.- Prediction Error Autocorrelations
opens the Model Viewer to display the prediction error autocorrelations, partial autocorrelations, and inverse autocorrelations for the currently highlighted model.- Prediction Error Tests
opens the Model Viewer to display graphs of white noise and stationarity tests on the prediction errors of the currently highlighted model.- Parameter Estimates
opens the Model Viewer to display the parameter estimates table for the currently highlighted model.- Statistics of Fit
opens the Model Viewer window to display goodness-of-fit statistics for the currently highlighted model.- Forecast Graph
opens the Model Viewer to graph the forecasts for the currently highlighted model.- Forecast Table
opens the Model Viewer to display forecasts for the currently highlighted model in a table.
- Tools
-
- Diagnose Series
opens the Series Diagnostics window to determine the kinds of forecasting models appropriate for the current series.- Define Interventions
opens the Interventions for Series window to enable you to edit or add intervention effects for use in modeling the current series.- Sort Models
sorts the models in the table by the values of the currently displayed fit statistic.- Compare Models
opens the Model Fit Comparison window to display fit statistics for selected pairs of forecasting models. This is unavailable if there are fewer than two models in the table.- Generate Data
opens the Time Series Simulation window. This window enables you to simulate ARIMA time series processes and is useful for educational exercises or testing the system.
- Options
-
- Time Ranges
opens the Time Ranges Specification window to enable you to change the fit and evaluation time ranges and the forecast horizon. This action is the same as the Set Ranges button.- Default Time Ranges
opens the Default Time Ranges window to enable you to control how the system sets the time ranges for series when you do not explicitly set time ranges with the Time Ranges Specification window. Settings made by using this window do not affect series you are already working with; they take effect when you select a new series.- Model Selection List
opens the Model Selection List editor window. Use this action to edit the set of forecasting models considered by the automatic model selection process and displayed by the Models to Fit window.- Model Selection Criterion
opens the Model Selection Criterion window, which presents a list of goodness-of-fit statistics and enables you to select the fit statistic that is displayed in the table and used by the automatic model selection process to determine the best fitting model. This action is the same as clicking the button above the table which displays the name of the current model selection criterion.- Statistics of Fit
opens the Statistics of Fit Selection window, which presents a list of statistics that the system can display. Use this action to customize the list of statistics shown in the Model Viewer, Automatic Model Fitting Results, and Model Fit Comparison windows and available for selection in the Model Selection Criterion menu.- Forecast Options
opens the Forecast Options window, which enables you to control the widths of forecast confidence limits and control the kind of predicted values computed for models that include series transformations.- Alignment of Dates
-
- Beginning
aligns dates that the system generates to identify forecast observations in output data sets to the beginning of the time intervals.- Middle
aligns dates that the system generates to identify forecast observations in output data sets to the midpoints of the time intervals.- End
aligns dates that the system generates to identify forecast observations in output data sets to the end of the time intervals.
- Automatic Fit
opens the Automatic Model Selection Options window, which enables you to control the number of models retained by the automatic model selection process and whether the models considered for automatic selection are subset according to the series diagnostics.- Include Interventions
controls whether intervention effects defined for the current series are automatically added as predictors to the models considered by the automatic selection process and displayed by the Models to Fit window. When the Include Interventions option is selected, the series interventions are also automatically added to the predictors list when you specify a model in the ARIMA and Custom Models Specification windows. A check mark or filled check box next to this item indicates that the option is turned on.- Print Audit Trail
prints to the SAS log information about the models fit by the system. A check mark or filled check box next to this item indicates that the audit option is turned on.- Show Source Statements
Controls whether SAS statements submitted by the forecasting system are printed in the SAS log. When the Show Source Statements option is selected, the system sets the SAS system option SOURCE before submitting SAS statements; otherwise, the system uses the NOSOURCE option. Note that only some of the functions performed by the forecasting system are accomplished by submitting SAS statements. A check mark or filled check box next to this item indicates that the option is turned on.
Left Mouse Button Actions for the Model Table
When the cursor is over the description of a model in the table, the left mouse button selects (highlights) or deselects that model. On some computer systems, you can double-click to open the Model Viewer window for the selected model.
When the cursor is over an empty part of the model table, the left mouse button opens a menu of model fitting choices. These choices are the same as those in the Fit Model submenu of the Edit menu.
Right Mouse Button Actions for the Model Table
When a model in the table is selected, the right mouse opens a menu of actions that apply to the highlighted model. The actions available in this menu are as follows.
- View Model
opens the Model Viewer for the selected model. This action is the same as the View Model Graphically icon.- View Parameter Estimates
opens the Model Viewer to display the parameter estimates table for the currently highlighted model. This is the same as the Parameter Estimates item in the View menu.- View Statistics of Fit
opens the Model Viewer to display a table of goodness-of-fit statistics for the currently highlighted model. This is the same as the Statistics of Fit item in the View menu.- Edit Model
enables you to modify the specification of the currently highlighted model in the table and fit the modified model. This is the same as the Edit Model item in the Edit menu.- Refit Model
refits the highlighted model by using data within the current fit range. This is the same as the Selected Model item under the Refit Models submenu of the Edit menu.- Reevaluate Model
reevaluates the highlighted model by using data within the evaluation fit range. This is the same as the Selected Model item under the Reevaluate Models submenu of the Edit menu.- Delete Model
deletes the currently highlighted model from the model table. This is the same as the Delete Model item under the Edit menu.- View Forecasts
opens the Model Viewer to display the forecasts for the currently highlighted model. This is the same as the Forecast Graph item under the View menu.
When the model list is empty or when no model is selected, the right mouse button opens the same menu of model fitting actions as the left mouse button.