| The Intervention Specification Window |
From the Develop Models window, select Fit ARIMA model. From the ARIMA Model Specification window, select Add and then select Linear Trend from the menu (shown in Figure 47.1).
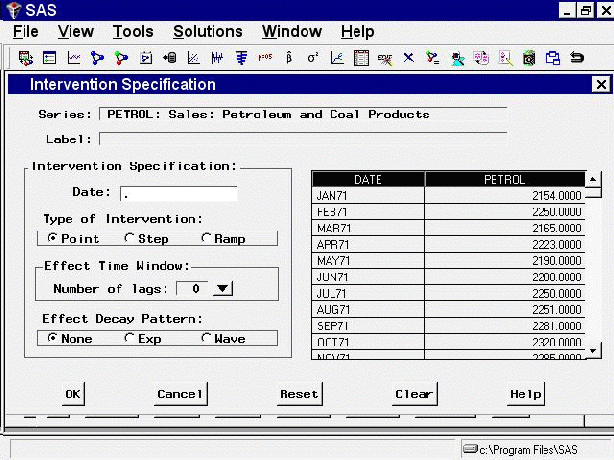
Select Add again and then select Interventions. If you have any interventions already defined for the series, this selection displays the Interventions for Series window. However, since you have not previously defined any interventions, this list is empty. Therefore, the system assumes that you want to add an intervention and displays the Intervention Specification window instead, as shown in Figure 47.15.

The top of the Intervention Specification window shows the current series and the label for the new intervention (initially blank). At the right side of the window is a scrollable table showing the values of the series. This table helps you locate the dates of the events you want to model.
At the left of the window is an area titled Intervention Specification that contains the options for defining the intervention predictor. The Date field specifies the time that the intervention occurs. You can type a date value in the Date field, or you can set the Date value by selecting a row from the table of series values at the right side of the window.
The area titled Type of Intervention controls the kind of indicator variable constructed to model the intervention effect. You can specify the following kinds of interventions:
- Point
is used to indicate an event that occurs in a single time period. An example of a point event is a strike that shuts down production for part of a time period. The value of the intervention’s indicator variable is zero except for the date specified.
- Step
is used to indicate a continuing event that changes the level of the series. An example of a step event is a change in the law, such as a tax rate increase. The value of the intervention’s indicator variable is zero before the date specified and 1 thereafter.
- Ramp
is used to indicate a continuing event that changes the trend of the series. The value of the intervention’s indicator variable is zero before the date specified, and it increases linearly with time thereafter.
The areas titled Effect Time Window and Effect Decay Pattern specify how to model the effect that the intervention has on the dependent series. These options are not used for simple interventions, they will be discussed later in this chapter.