| Iteration History |
The options ITPRINT, ITDETAILS, XPX, I, and ITALL specify a detailed listing of each iteration of the minimization process.
ITPRINT Option
The ITPRINT information is selected whenever any iteration information is requested.
The following information is displayed for each iteration:
- N
is the number of usable observations.
- Objective
is the corrected objective function value.
- Trace(S)
is the trace of the S matrix.
- subit
is the number of subiterations required to find a
 or a damping factor that reduces the objective function.
 - R
is the R convergence measure.
The estimates for the parameters at each iteration are also printed.
ITDETAILS Option
The additional values printed for the ITDETAILS option are:
- Theta
is the angle in degrees between
 , the parameter change vector, and the negative gradient of the objective function.
 - Phi
is the directional derivative of the objective function in the
direction scaled by the objective function. - Stepsize
is the value of the damping factor used to reduce
if the Gauss-Newton method is used. - Lambda
is the value of
if the Marquardt method is used. - Rank(XPX)
is the rank of the
 matrix (output if the projected Jacobian crossproducts matrix is singular).
The definitions of PPC and R are explained in the section Convergence Criteria. When the values of PPC are large, the parameter associated with the criteria is displayed in parentheses after the value.
XPX and I Options
The XPX and the I options select the printing of the augmented matrix and the augmented matrix after a sweep operation (Goodnight 1979) has been performed on it. An example of the output from the following statements is shown in Figure 19.34.
proc model data=test2;
   y1 = a1 * x2 * x2 - exp( d1*x1);
   y2 = a2 * x1 * x1 + b2 * exp( d2*x2);
   fit y1 y2 / itall XPX I ;
run;
| Cross Products for System At OLS Iteration 0 | ||||||
|---|---|---|---|---|---|---|
| a1 | d1 | a2 | b2 | d2 | Residual | |
| a1 | 1839468 | -33818.35 | 0.0 | 0.00 | 0.000000 | 3879959 |
| d1 | -33818 | 1276.45 | 0.0 | 0.00 | 0.000000 | -76928 |
| a2 | 0 | 0.00 | 42925.0 | 1275.15 | 0.154739 | 470686 |
| b2 | 0 | 0.00 | 1275.2 | 50.01 | 0.003867 | 16055 |
| d2 | 0 | 0.00 | 0.2 | 0.00 | 0.000064 | 2 |
| Residual | 3879959 | -76928.14 | 470686.3 | 16055.07 | 2.329718 | 24576144 |
| XPX Inverse for System At OLS Iteration 0 | ||||||
|---|---|---|---|---|---|---|
| a1 | d1 | a2 | b2 | d2 | Residual | |
| a1 | 0.000001 | 0.000028 | 0.000000 | 0.0000 | 0.00 | 2 |
| d1 | 0.000028 | 0.001527 | 0.000000 | 0.0000 | 0.00 | -9 |
| a2 | 0.000000 | 0.000000 | 0.000097 | -0.0025 | -0.08 | 6 |
| b2 | 0.000000 | 0.000000 | -0.002455 | 0.0825 | 0.95 | 172 |
| d2 | 0.000000 | 0.000000 | -0.084915 | 0.9476 | 15746.71 | 11931 |
| Residual | 1.952150 | -8.546875 | 5.823969 | 171.6234 | 11930.89 | 10819902 |
The first matrix, labeled "Cross Products," for OLS estimation is
 |
The column labeled Residual in the output is the vector  , which is the gradient of the objective function. The diagonal scalar value
  is the objective function uncorrected for degrees of freedom. The second matrix, labeled "XPX Inverse," is created through a sweep operation on the augmented matrix to get:
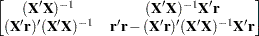 |
Note that the residual column is the change vector used to update the parameter estimates at each iteration. The corner scalar element is used to compute the R convergence criteria.
ITALL Option
The ITALL option, in addition to causing the output of all of the preceding options, outputs the S matrix, the inverse of the S matrix, the CROSS matrix, and the swept CROSS matrix. An example of a portion of the CROSS matrix for the preceding example is shown in Figure 19.35.
| Crossproducts Matrix At OLS Iteration 0 | ||||||||
|---|---|---|---|---|---|---|---|---|
| 1 | @PRED.y1/@a1 | @PRED.y1/@d1 | @PRED.y2/@a2 | @PRED.y2/@b2 | @PRED.y2/@d2 | RESID.y1 | RESID.y2 | |
| 1 | 50.00 | 6409 | -239.16 | 1275.0 | 50.00 | 0.003803 | 14700 | 16053 |
| @PRED.y1/@a1 | 6409.08 | 1839468 | -33818.35 | 187766.1 | 6409.88 | 0.813934 | 3879959 | 4065028 |
| @PRED.y1/@d1 | -239.16 | -33818 | 1276.45 | -7253.0 | -239.19 | -0.026177 | -76928 | -85084 |
| @PRED.y2/@a2 | 1275.00 | 187766 | -7253.00 | 42925.0 | 1275.15 | 0.154739 | 420583 | 470686 |
| @PRED.y2/@b2 | 50.00 | 6410 | -239.19 | 1275.2 | 50.01 | 0.003867 | 14702 | 16055 |
| @PRED.y2/@d2 | 0.00 | 1 | -0.03 | 0.2 | 0.00 | 0.000064 | 2 | 2 |
| RESID.y1 | 14699.97 | 3879959 | -76928.14 | 420582.9 | 14701.77 | 1.820356 | 11827102 | 12234106 |
| RESID.y2 | 16052.76 | 4065028 | -85083.68 | 470686.3 | 16055.07 | 2.329718 | 12234106 | 12749042 |