The ESM Procedure

Example 14.5 Illustration of ODS Graphics
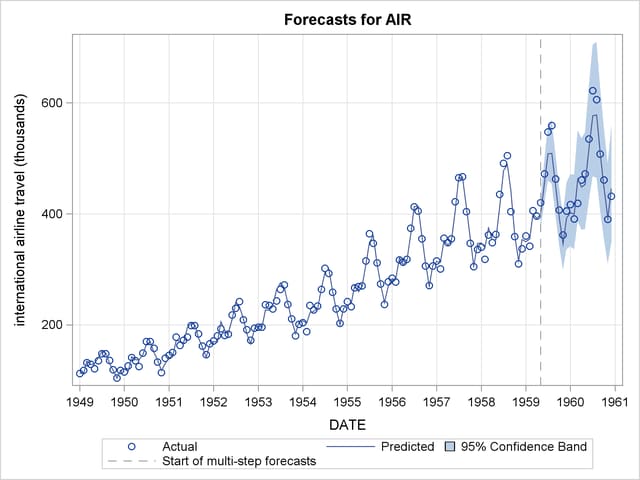
This example illustrates the use of ODS graphics in the ESM procedure and uses the SASHELP.AIR data set to forecast the time series of international airline travel.
The graphical displays are requested by specifying the PLOT= option in the PROC ESM statement. In this case, all plots are requested. Output 14.5.1 through Output 14.5.5 show a selection of the plots created.
For information about the graphics available in the ESM procedure, see the section ODS Graphics.
proc esm data=sashelp.air out=_null_
         lead=20
         back=20
         print=all
         plot=all;
   id date interval=month;
   forecast air / model=addwinters transform=log;
run;
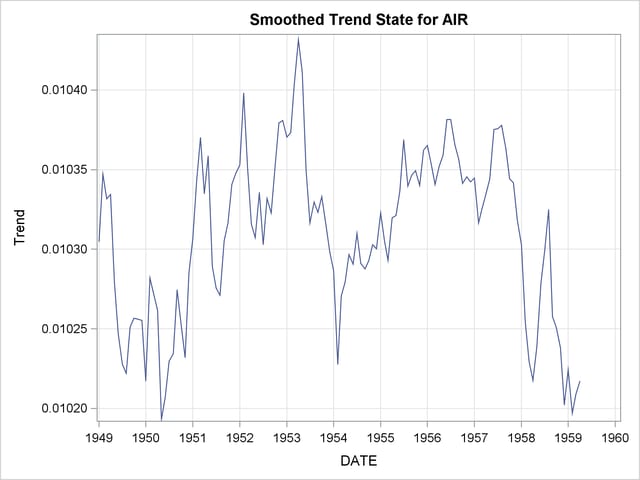
Output 14.5.1
Smoothed Trend Plot
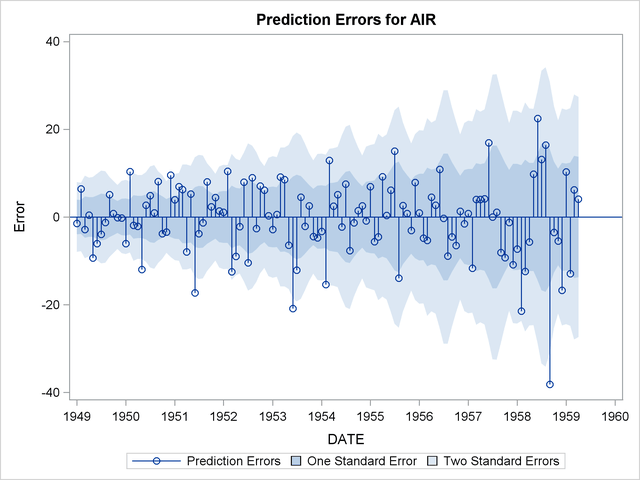
Output 14.5.2
Prediction Error Plot
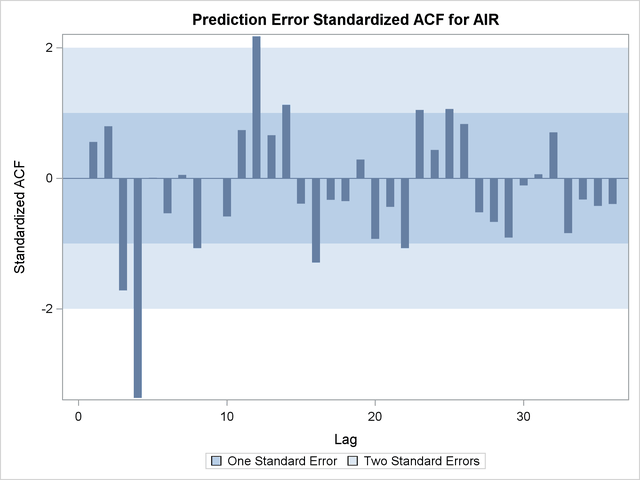
Output 14.5.3
Prediction Error Standardized ACF Plot
Output 14.5.4
Forecast Plot
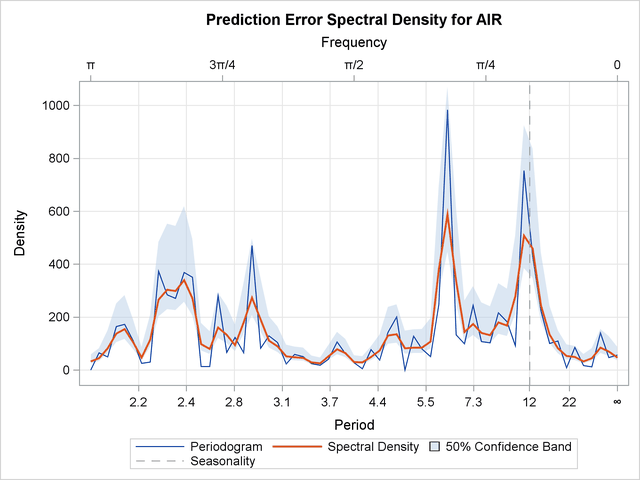
Output 14.5.5
Prediction Error Spectral Density