| The TSCSREG Procedure |
| Introductory Example |
The following example uses the cost function data from Greene (1990) to estimate the variance components model. The variable OUTPUT is the log of output in millions of kilowatt-hours, and COST is the log of cost in millions of dollars. Refer to Greene (1990) for details.
   title1;
   data greene;
      input firm year output cost @@;
      df1 = firm = 1;
      df2 = firm = 2;
      df3 = firm = 3;
      df4 = firm = 4;
      df5 = firm = 5;
      d60 = year = 1960;
      d65 = year = 1965;
      d70 = year = 1970;
   datalines;

   ... more lines ...
Usually you cannot explicitly specify all the explanatory variables that affect the dependent variable. The omitted or unobservable variables are summarized in the error disturbances. The TSCSREG procedure used with the RANTWO option specifies the two-way random-effects error model where the variance components are estimated by the Fuller-Battese method, because the data are balanced and the parameters are efficiently estimated by using the GLS method. The variance components model used by the Fuller-Battese method is
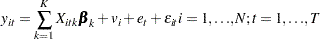 |
The following statements fit this model.
proc sort data=greene;
   by firm year;
run;

proc tscsreg data=greene;
   model cost = output / rantwo;
   id firm year;
run;
The TSCSREG procedure output is shown in Figure 30.1. A model description is printed first; it reports the estimation method used and the number of cross sections and time periods. The variance components estimates are printed next. Finally, the table of regression parameter estimates shows the estimates, standard errors, and t tests.
| Model Description | |
|---|---|
| Estimation Method | RanTwo |
| Number of Cross Sections | 6 |
| Time Series Length | 4 |
Copyright © SAS Institute, Inc. All Rights Reserved.