| The TIMESERIES Procedure |
Example 29.5 Illustration of Singular Spectrum Analysis
This example illustrates the use of singular spectrum analysis.
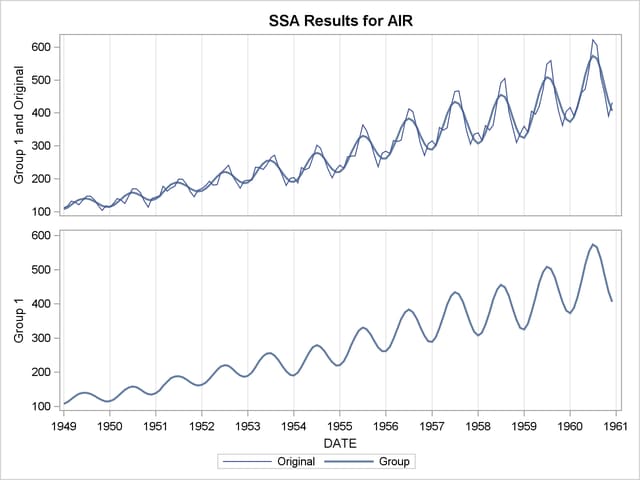
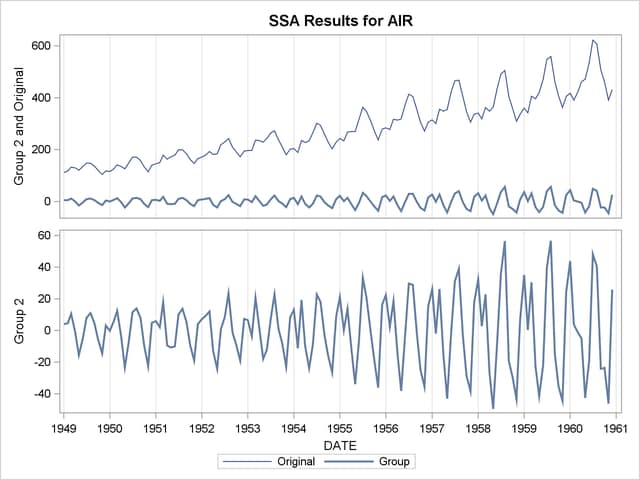
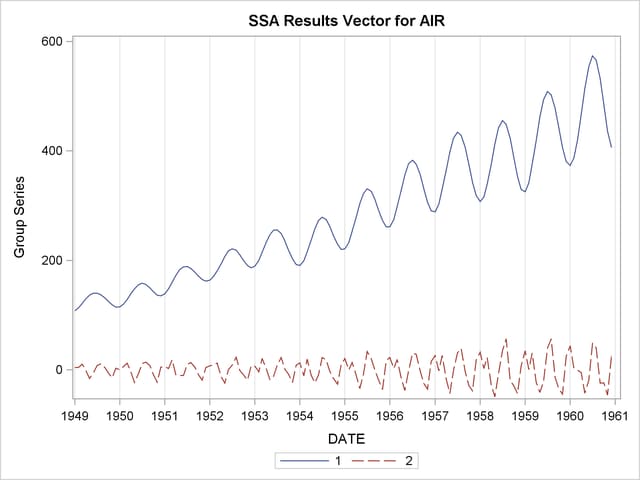
The following statements extract two additive components from the SASHELP.AIR time series by using the THRESHOLDPCT= option to specify that the first component represent 80% of the variability in the series. The resulting groupings, consisting of the first three and remaining nine singular value components, are presented in Output 29.5.1 through Output 29.5.3.
title "SSA of AIR data";

proc timeseries data=sashelp.air plot=ssa;
   id date interval=month;
   var air;
   ssa / length=12 THRESHOLDPCT=80;
run;
Output 29.5.1
Singular Value Grouping #1 Plot
Output 29.5.2
Singular Value Grouping #2 Plot
Output 29.5.3
Singular Value Components Plot
Copyright © SAS Institute, Inc. All Rights Reserved.