| The TIMESERIES Procedure |
Example 29.3 Illustration of ODS Graphics
This example illustrates the use of ODS graphics.
The following statements use the SASHELP.WORKERS data set to study the time series of electrical workers and its interaction with the simply differenced series of masonry workers. The series plot, the correlation panel, the seasonal adjustment panel, and all cross-series plots are requested. Output 29.3.1 through Output 29.3.4 show a selection of the plots created.
The graphical displays are requested by specifying the ODS GRAPHICS statement and the PLOTS= or CROSSPLOTS= options in the PROC TIMESERIES statement. For information about the graphics available in the TIMESERIES procedure, see the section ODS Graphics Names.
title "Illustration of ODS Graphics";
proc timeseries data=sashelp.workers out=_null_
                plots=(series corr decomp)
                crossplots=all;
   id date interval=month;
   var electric;
   crossvar masonry / dif=(1);
run;
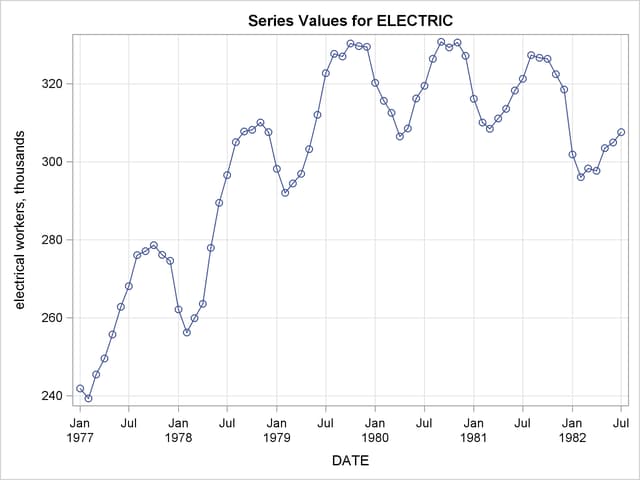
Output 29.3.1
Series Plot
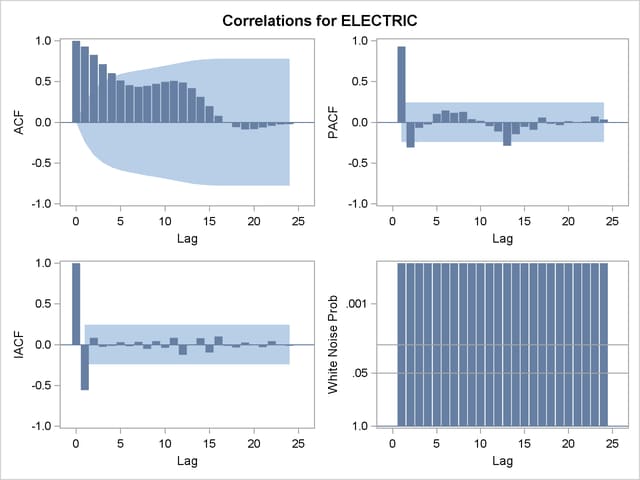
Output 29.3.2
Correlation Panel
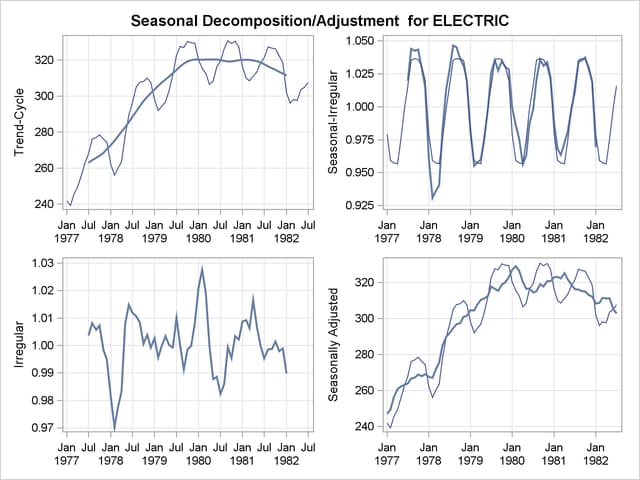
Output 29.3.3
Seasonal Decomposition Panel
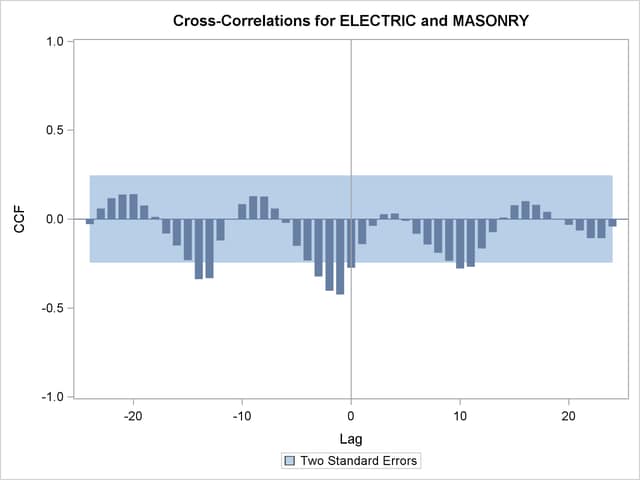
Output 29.3.4
Cross-Correlation Plot
Copyright © SAS Institute, Inc. All Rights Reserved.