| The TIMEID Procedure |
| Diagnostic Output Representation |
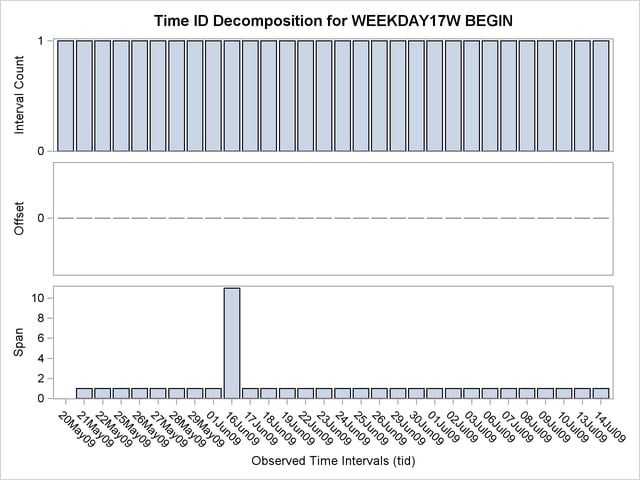
The TIMEID procedure produces time ID diagnostics as both time-ID-based and count-based frequency distributions to expose many of the possible problems that can occur in a time ID variable. The time-ID-based frequency distributions that are generated with the PLOT= option provide a detailed view of time ID values that can isolate problems with specific ID values. Figure 28.1 shows a time series that has a span of 10 observations in a weekday series based on the results of the PLOT=(VALUES SPANS) option. The single large bar in the spans plot shows where data are omitted.
The count-based frequency distributions summarize features of the time ID variable. Individual printed and plotted outputs are available to describe the distribution of the number of spans, offsets, and interval counts that occur in the time ID variable. Figure 28.2 illustrates a count-based frequency distribution of the spans within the weekday series.
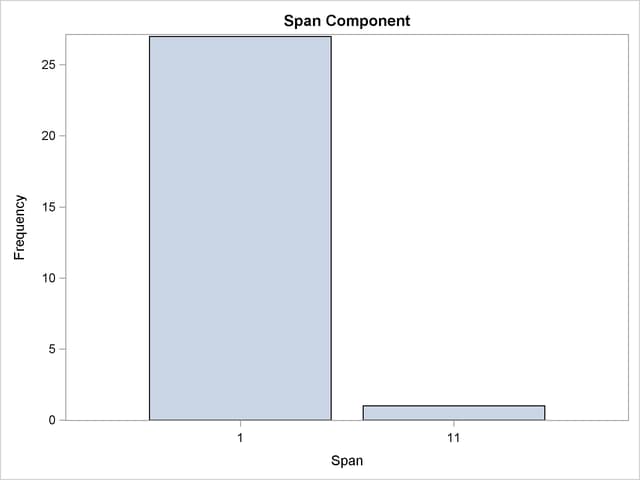
The large bar at the span of 1 shows that most of the observations are correctly separated by one interval. The bar at 11 indicates that one observation is separated by 11 intervals from the preceding value of the time ID variable. This further illustrates a span of 10 omitted observations.
Copyright © SAS Institute, Inc. All Rights Reserved.