| Getting Started with Time Series Forecasting |
| Forecasts and Confidence Limits Plots |
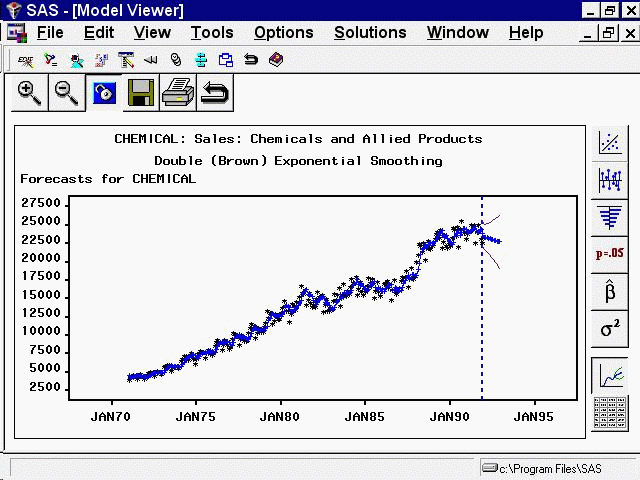
Select the seventh icon from the top in the vertical toolbar to the right of the graph. This switches the Viewer to display a plot of forecast values and confidence limits, together with actual values and one-step-ahead within-sample predictions, as shown in Figure 39.47.
Figure 39.47
Model Viewer: Forecasts and Confidence Limits
Copyright © SAS Institute, Inc. All Rights Reserved.