| Getting Started with Time Series Forecasting |
| Parameter Estimates Table |
Select the fifth icon from the top in the vertical toolbar to the right of the graph. This switches the Viewer to display a table of parameter estimates for the fitted model, as shown in Figure 39.44.
Figure 39.44
Model Viewer: Parameter Estimates Table
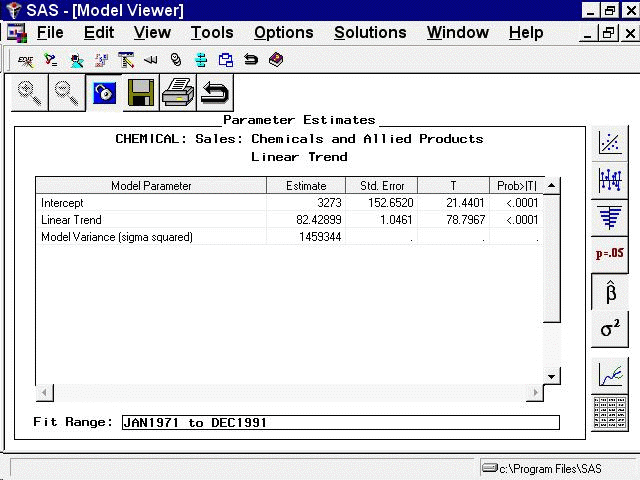
For the linear trend model, the parameters are the intercept and slope coefficients. The table shows the values of the fitted coefficients together with standard errors and t tests for the statistical significance of the estimates. The model residual variance is also shown.
Copyright © SAS Institute, Inc. All Rights Reserved.