| Getting Started with Time Series Forecasting |
| Introduction |
From the Time Series Forecasting window, select the Browse button to the right of the Data Set field to open the Data Set Selection window. Select the USECON data set from the SASHELP library. This data set contains monthly data on the U.S. economy.
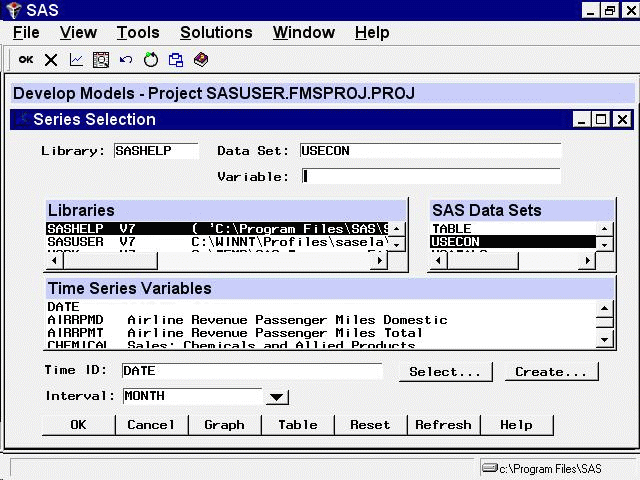
Select OK to close the selection window. Now select the Develop Models button. This opens the Series Selection window, as shown in Figure 39.29. You can enlarge this window for easier viewing of lists of data sets and series.

Select the series CHEMICAL: Sales of Chemicals and Allied Products, and then select the OK button.
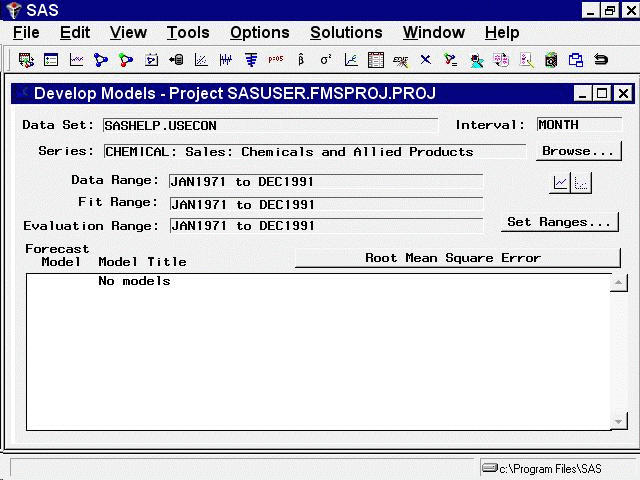
This opens the Develop Models window, as shown in Figure 39.30.

The Data Set, Interval, and Series fields in the upper part of the Develop Models window indicate the series with which you are currently working. You can change the settings of these fields by selecting the Browse button.
The Data Range, Fit Range, and Evaluation Range fields show the time period over which data are available for the current series, and what parts of that time period are used to fit forecasting models to the series and to evaluate how well the models fit the data. You can change the settings of these fields by selecting the Set Ranges button.
The bottom part of the Develop Models window consists of a table of forecasting models fit to the series. Initially, the list is empty, as indicated by the message "No models." You can fit any number of forecasting models to each series and designate which one you want to use to produce forecasts.
Graphical tools are available for exploring time series and fitted models. The two icons below the Browse button access the Time Series Viewer and the Model Viewer.
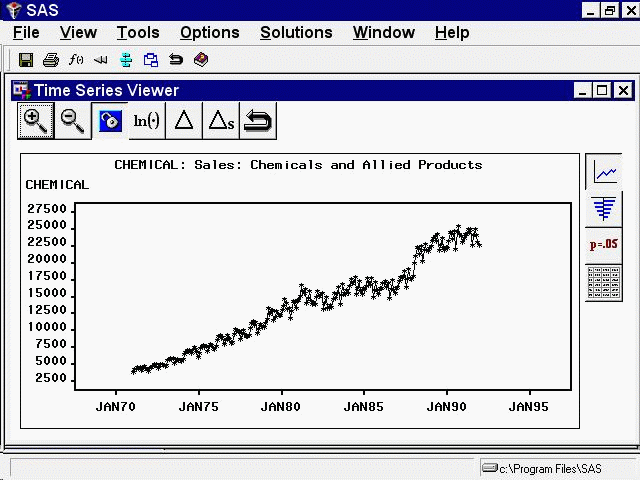
Select the left icon. This opens the Time Series Viewer window, as shown in Figure 39.31.

The Time Series Viewer displays a plot of the CHEMICAL series. The Time Series Viewer offers many useful features, which are explored in later sections.
The Time Series Viewer appears in a separate resizable window. You can switch back and forth between the Time Series Viewer window and other windows. For now, return to the Develop Models window. You can close the Time Series Viewer window or leave it open. (To close the Time Series Viewer window, select Close from the toolbar or from the File menu.)
Copyright © SAS Institute, Inc. All Rights Reserved.