| Investments |
| Bond Analysis |
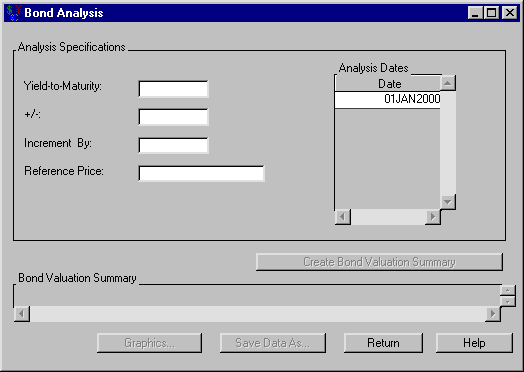
Clicking Analyze from the Bond dialog box opens the Bond Analysis dialog box displayed in Figure 50.32.
The following items are displayed:
Analysis Specifications
Yield-to-maturity holds the percentage yield upon which to center the analysis.
+/- holds the maximum deviation percentage to consider from the Yield-to-maturity.
Increment by holds the percentage increment by which the analysis is calculated.
Reference Price holds the reference price.
Analysis Dates holds a list of SAS dates for which you perform the bond analysis.
You must specify the analysis before valuing the bond for the various yields. After you adequately specify the analysis, click Create Bond Valuation Summary to generate the bond valuation summary.
Bond Valuation Summary fills when you click Create Bond Valuation Summary. The schedule contains a row for each rate with information concerning the following:
Date is the SAS date when the Value gives the particular Yield.
Yield is the percent yield that corresponds to the Value at the given Date.
Value is the value of the bond at Date for the given Yield.
Percent Change is the percent change if the Reference Price is specified.
Duration is the duration.
Convexity is the convexity.
Graphics opens the Bond Price graph that represents the price versus yield-to-maturity.
Print becomes available when you generate the Bond Valuation Summary. Clicking it sends the contents of the summary to the SAS session print device.
Save Data As becomes available when you fill the Bond Valuation Summary area. Clicking it opens the Save Output Dataset dialog box where you can save the valuation summary (or portions thereof) as a SAS Dataset.
Return takes you back to the Bond dialog box.
Copyright © SAS Institute, Inc. All Rights Reserved.