| The ARIMA Procedure |
| Forecasting Stage |
To produce the forecast, use a FORECAST statement after the ESTIMATE statement for the model you decide is best. If the last model fit is not the best, then repeat the ESTIMATE statement for the best model before you use the FORECAST statement.
Suppose that the SALES series is monthly, that you want to forecast one year ahead from the most recently available SALES figure, and that the dates for the observations are given by a variable DATE in the input data set TEST. You use the following FORECAST statement:
   forecast lead=12 interval=month id=date out=results;
   run;
The LEAD= option specifies how many periods ahead to forecast (12 months, in this case). The ID= option specifies the ID variable, which is typically a SAS date, time, or datetime variable, used to date the observations of the SALES time series. The INTERVAL= option indicates that data are monthly and enables PROC ARIMA to extrapolate DATE values for forecast periods. The OUT= option writes the forecasts to the output data set RESULTS. See the section OUT= Data Set for information about the contents of the output data set.
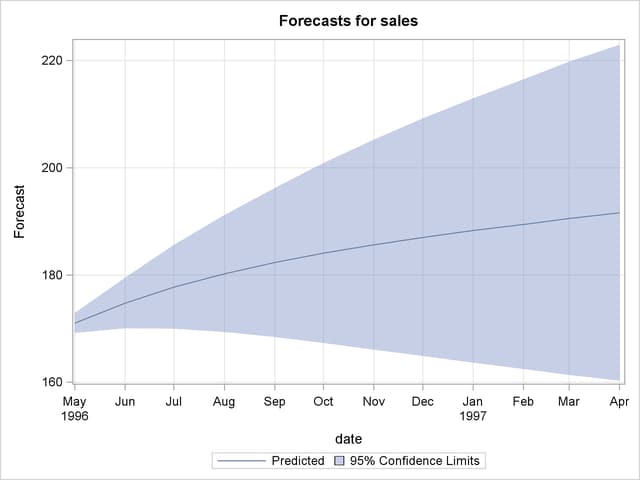
By default, the FORECAST statement also prints and plots the forecast values, as shown in Figure 7.18 and Figure 7.19. The forecast table shows for each forecast period the observation number, forecast value, standard error estimate for the forecast value, and lower and upper limits for a 95% confidence interval for the forecast.
| Forecasts for variable sales | ||||
|---|---|---|---|---|
| Obs | Forecast | Std Error | 95% Confidence Limits | |
| 101 | 171.0320 | 0.9508 | 169.1684 | 172.8955 |
| 102 | 174.7534 | 2.4168 | 170.0165 | 179.4903 |
| 103 | 177.7608 | 3.9879 | 169.9445 | 185.5770 |
| 104 | 180.2343 | 5.5658 | 169.3256 | 191.1430 |
| 105 | 182.3088 | 7.1033 | 168.3866 | 196.2310 |
| 106 | 184.0850 | 8.5789 | 167.2707 | 200.8993 |
| 107 | 185.6382 | 9.9841 | 166.0698 | 205.2066 |
| 108 | 187.0247 | 11.3173 | 164.8433 | 209.2061 |
| 109 | 188.2866 | 12.5807 | 163.6289 | 212.9443 |
| 110 | 189.4553 | 13.7784 | 162.4501 | 216.4605 |
| 111 | 190.5544 | 14.9153 | 161.3209 | 219.7879 |
| 112 | 191.6014 | 15.9964 | 160.2491 | 222.9538 |
Normally, you want the forecast values stored in an output data set, and you are not interested in seeing this printed list of the forecast. You can use the NOPRINT option in the FORECAST statement to suppress this output.
Copyright © SAS Institute, Inc. All Rights Reserved.