| The VARMAX Procedure |
Example 30.4 Illustration of ODS Graphics
This example illustrates the use of ODS Graphics. The graphical displays are requested by specifying the ODS GRAPHICS ON statement. For information about the graphics available in the VARMAX procedure, see the section ODS Graphics.
The following statements use the SASHELP.WORKERS data set to study the time series of electrical workers and its interaction with the series of masonry workers. The series and predict plots, the residual plot, and the forecast plot are created in Output 30.4.1 through Output 30.4.3. These are a selection of the plots created by the VARMAX procedure.
   title "Illustration of ODS Graphics";
   proc varmax data=sashelp.workers plot(unpack)=(residual model forecasts);
      id date interval=month;
      model electric masonry / dify=(1,12) noint p=1;
      output lead=12;
   run;
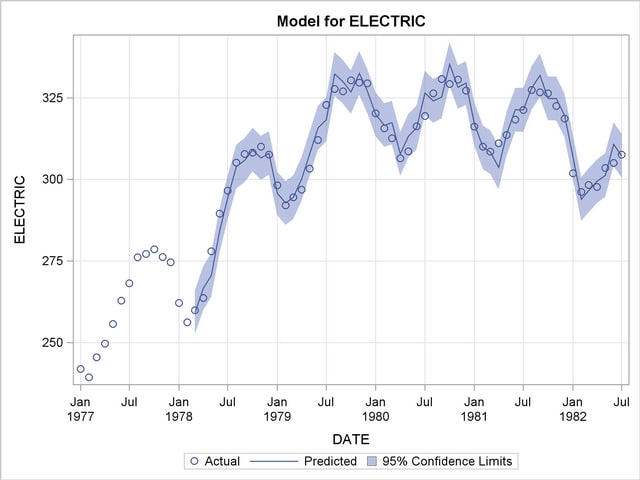
Output 30.4.1
Series and Predicted Series Plots
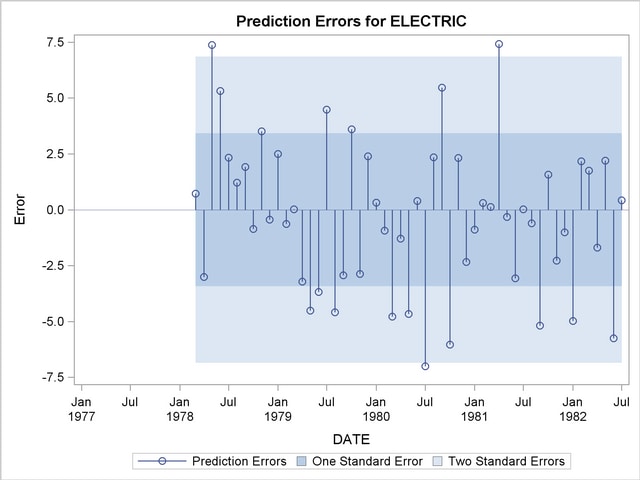
Output 30.4.2
Residual Plot
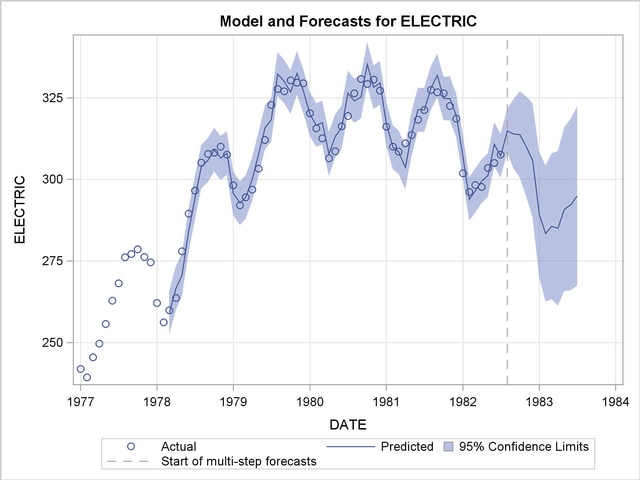
Output 30.4.3
Series and Forecast Plots
Copyright © 2008 by SAS Institute Inc., Cary, NC, USA. All rights reserved.