| Working with Time Series Data |
| Using PROC GPLOT |
The GPLOT procedure in SAS/GRAPH software can also be used to plot time series data, although the newer SGPLOT procedure is easier to use.
The following is an example of how GPLOT can be used to produce a plot similar to the graph produced by PROC SGPLOT in the preceding section.
   title "Plot of USCPI Data";
   proc gplot data=uscpi;
      symbol i=spline v=circle h=2;
      plot cpi * date;
   run;
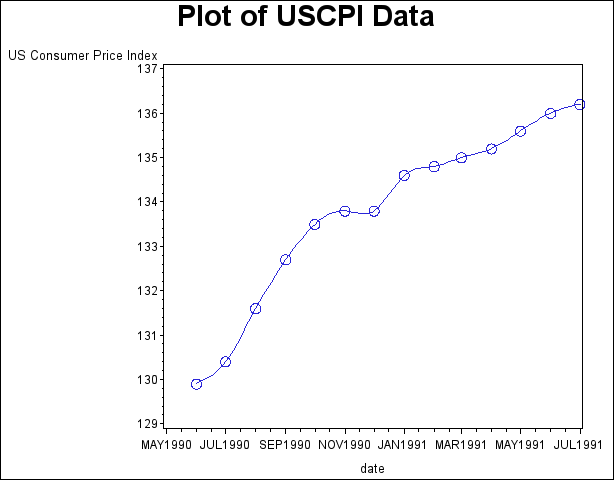
The plot is shown in Figure 3.15.
Figure 3.15
Plot of Monthly CPI Over Time
For more information about the GPLOT procedure, see SAS/GRAPH Software: Reference.
Copyright © 2008 by SAS Institute Inc., Cary, NC, USA. All rights reserved.