| Window Reference |
Automatic Model Fitting Results Window
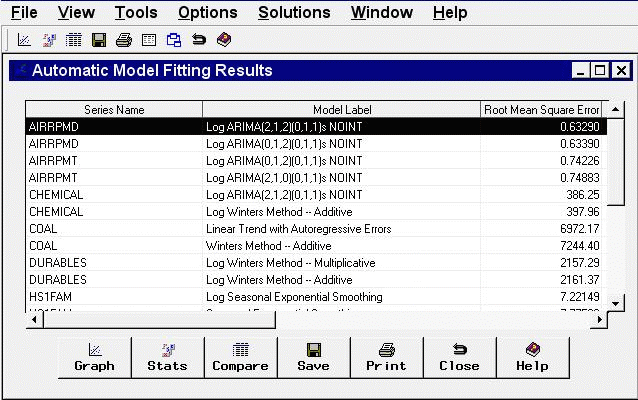
This resizable window displays the models fit by the most recent invocation of the Automatic Model Fitting window. It appears automatically after Automatic Model Fitting runs, and can be opened repeatedly from that window by using the Models Fit button or by selecting Models Fit from the View menu. Once you exit the Automatic Model Fitting window, the Automatic Model Fitting Results window cannot be opened again until you fit additional models by using Automatic Model Fitting.

Table Contents The results table displays the series name in the first column and the model label in the second column. If you have chosen to retain more than one model by using the Automatic Model Selection Options window, more than one row appears in the table for each series; that is, there is a row for each model fit. If you have already fit models to the same series before invoking the Automatic Model Fitting window, those models do not appear here, since the Automatic Model Fitting Results window is intended to show the results of the current operation of Automatic Model Fitting. To see all models that have been fit, use the Manage Projects window.
The third column of the table shows the values of the current model selection criterion statistic. Additional columns show the values of other fit statistics. The set of statistics shown are selectable by using the Statistics of Fit Selection window.
The table can be sorted by any column other than Series Name by clicking on the column heading.
Controls and Fields
- Graph
opens the Model Viewer window on the model currently selected in the table.- Stats
opens the Statistics of Fit Selection window. This controls the set of goodness-of-fit statistics displayed in the table and in other parts of the Time Series Forecasting System.- Compare
opens the Model Fit Comparison window for the series currently selected in the table. This button is unavailable if the currently selected row in the table represents a series for which fewer than two models have been fit.- Save
opens an output data set dialog, enabling you to specify a SAS data set to which the contents of the table is saved. Note that this operation saves what you see in the table. If you want to save the models themselves for use in a future session, use the Manage Projects window.
prints the contents of the table.- Close
closes the window and returns to the Automatic Model Fitting window.
Menu Bar
- File
- Save
opens an output data set dialog, enabling you to specify a SAS data set to which the contents of the table is saved. This is the same as the Save button.
prints the contents of the table. This is the same as the Print button.- Import Data
is available if you license SAS/Access software. It opens an Import Wizard, which you can use to import your data from an external spreadsheet or data base to a SAS data set for use in the Time Series Forecasting System.- Export Data
is available if you license SAS/Access software. It opens an Export Wizard, which you can use to export a SAS data set, such as a forecast data set created with the Time Series Forecasting System, to an external spreadsheet or data base.- Print Setup
opens the Print Setup window, which allows you to access your operating system print setup.- Close
closes the window and returns to the Automatic Model Fitting window.
- View
- Model Predictions
opens the Model Viewer to display a predicted and actual plot for the currently highlighted model.- Prediction Errors
opens the Model Viewer to display the prediction errors for the currently highlighted model.- Prediction Error Autocorrelations
opens the Model Viewer to display the prediction error autocorrelations, partial autocorrelations, and inverse autocorrelations for the currently highlighted model.- Prediction Error Tests
opens the Model Viewer to display graphs of white noise and stationarity tests on the prediction errors of the currently highlighted model.- Parameter Estimates
opens the Model Viewer to display the parameter estimates table for the currently highlighted model.- Statistics of Fit
opens the Model Viewer window to display goodness-of-fit statistics for the currently highlighted model.- Forecast Graph
opens the Model Viewer to graph the forecasts for the currently highlighted model.- Forecast Table
opens the Model Viewer to display forecasts for the currently highlighted model in a table.
- Tools
- Compare Models
opens the Model Fit Comparison window to display fit statistics for selected pairs of forecasting models. This item is unavailable until you select a series in the table for which the automatic model fitting run selected two or more models.
- Options
- Statistics of Fit
opens the Statistics of Fit Selection window. This is the same as the Stats button.- Column Labels
selects long or short column labels for the table. Long column labels are used by default.- ID Columns
freezes or unfreezes the series and model columns. By default they are frozen so that they remain visible when you scroll the table horizontally to view other columns.
Copyright © 2008 by SAS Institute Inc., Cary, NC, USA. All rights reserved.