| Using Predictor Variables |
| Specifying a Trend Change Intervention |
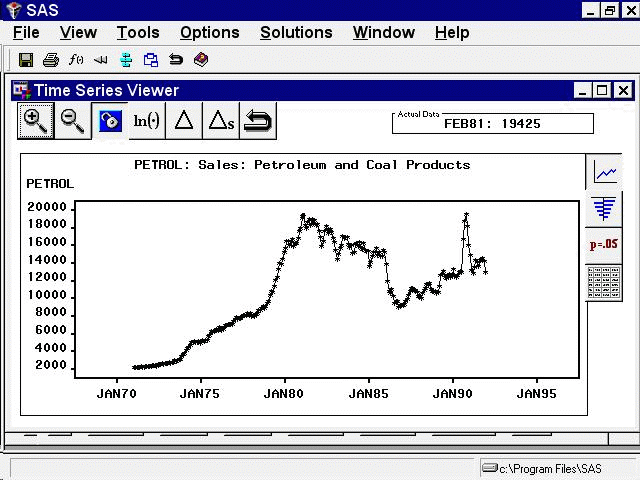
In the Time Series Viewer window position the mouse over the highest point in 1981 and select the point. This displays the data value, 19425, and date, February 1981, of that point in the upper-right corner of the Time Series Viewer, as shown in Figure 41.16.
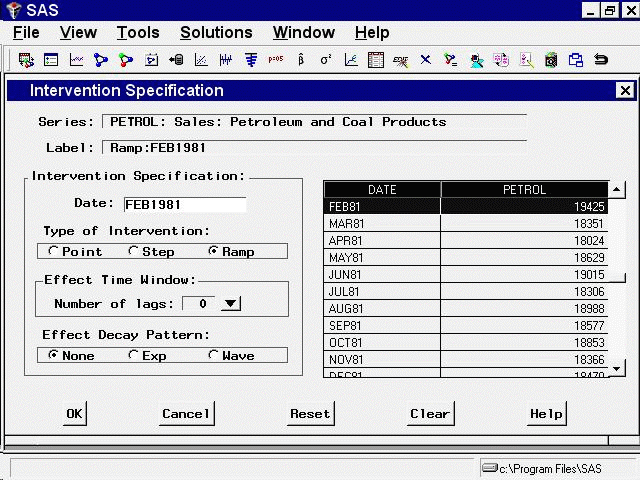
Now that you know the date that the trend reversal occurred, enter that date in the Date field of the Intervention Specification window. Select Ramp as the type of intervention. The window should now appear as shown in Figure 41.17.
Select the OK button. This adds the intervention to the list of interventions for the PETROL series, and returns you to the Interventions for Series window, as shown in Figure 41.18.
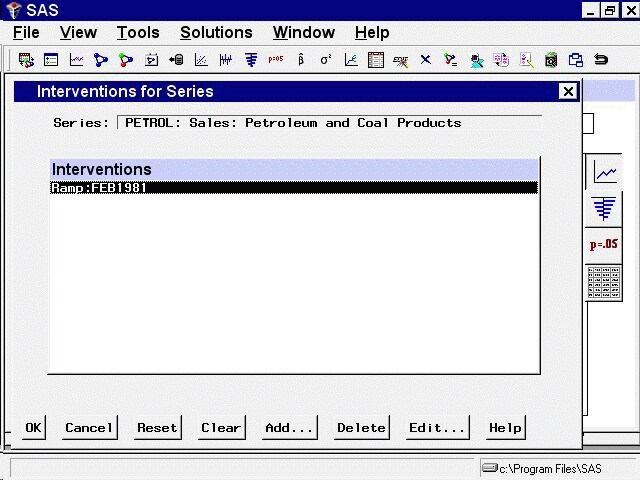
This window allows you to select interventions for inclusion in the forecasting model. Since you need to define other interventions, select the Add button. This returns you to the Intervention Specification window (shown in Figure 41.15).
Copyright © 2008 by SAS Institute Inc., Cary, NC, USA. All rights reserved.