| The SPECTRA Procedure |
Example 24.2 Cross-Spectral Analysis
This example uses simulated data to show cross-spectral analysis for two variables X and Y. X is generated by an AR(1) process; Y is generated as white noise plus an input from X lagged 2 periods. All output options are specified in the PROC SPECTRA statement. PROC CONTENTS shows the contents of the OUT= data set.
   data a;
      xl = 0; xll = 0;
      do i = - 10 to 100;
         x = .4 * xl  + rannor(123);
         y = .5 * xll + rannor(123);
         if i > 0 then output;
         xll = xl; xl = x;
      end;
   run;
   proc spectra data=a out=b cross coef a k p ph s;
      var x y;
      weights 1 1.5 2 4 8 9 8 4 2 1.5 1;
   run;

   proc contents data=b position;
   run;
The PROC CONTENTS report for the output data set B is shown in Output 24.2.1.
| Alphabetic List of Variables and Attributes | ||||
|---|---|---|---|---|
| # | Variable | Type | Len | Label |
| 16 | A_01_02 | Num | 8 | Amplitude of x by y |
| 3 | COS_01 | Num | 8 | Cosine Transform of x |
| 5 | COS_02 | Num | 8 | Cosine Transform of y |
| 13 | CS_01_02 | Num | 8 | Cospectra of x by y |
| 1 | FREQ | Num | 8 | Frequency from 0 to PI |
| 12 | IP_01_02 | Num | 8 | Imag Periodogram of x by y |
| 15 | K_01_02 | Num | 8 | Coherency**2 of x by y |
| 2 | PERIOD | Num | 8 | Period |
| 17 | PH_01_02 | Num | 8 | Phase of x by y |
| 7 | P_01 | Num | 8 | Periodogram of x |
| 8 | P_02 | Num | 8 | Periodogram of y |
| 14 | QS_01_02 | Num | 8 | Quadrature of x by y |
| 11 | RP_01_02 | Num | 8 | Real Periodogram of x by y |
| 4 | SIN_01 | Num | 8 | Sine Transform of x |
| 6 | SIN_02 | Num | 8 | Sine Transform of y |
| 9 | S_01 | Num | 8 | Spectral Density of x |
| 10 | S_02 | Num | 8 | Spectral Density of y |
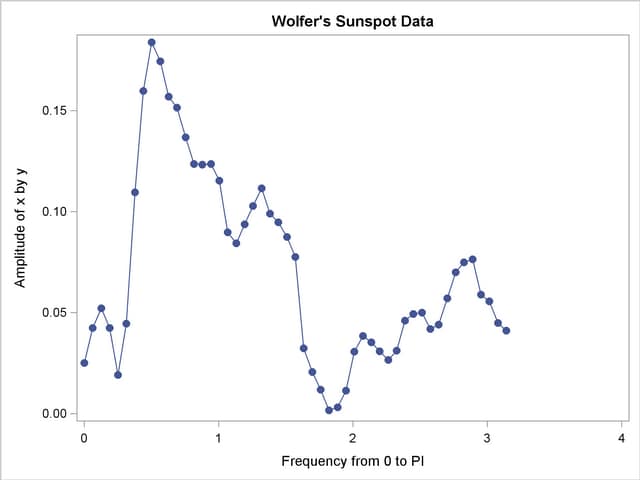
The following statements plot the amplitude of the cross-spectrum estimate against frequency and against period for periods less than 25.
   proc sgplot data=b;
      series x=freq y=a_01_02 / markers markerattrs=(symbol=circlefilled);
      xaxis values=(0 to 4 by 1);
   run;
The plot of the amplitude of the cross-spectrum estimate against frequency is shown in Output 24.2.2.
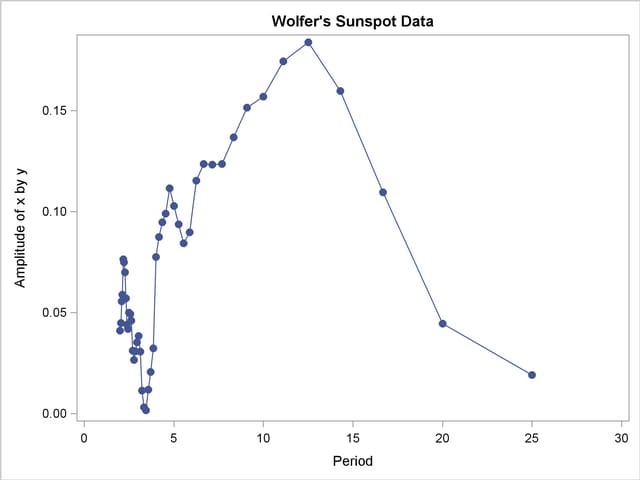
The plot of the cross-spectrum amplitude against period for periods less than 25 observations is shown in Output 24.2.3.
   proc sgplot data=b;
      where period < 25;
      series x=period y=a_01_02 / markers markerattrs=(symbol=circlefilled);
      xaxis values=(0 to 30 by 5);
   run;
Copyright © 2008 by SAS Institute Inc., Cary, NC, USA. All rights reserved.