| Analyses |
| Breakeven Graph |
Suppose you perform a breakeven analysis in the Breakeven Analysis dialog box. Once you create the breakeven analysis summary, you can click the Graphics button to open the Breakeven Graph dialog box displayed in Figure 49.14.
Figure 49.14
Breakeven Graph Dialog Box
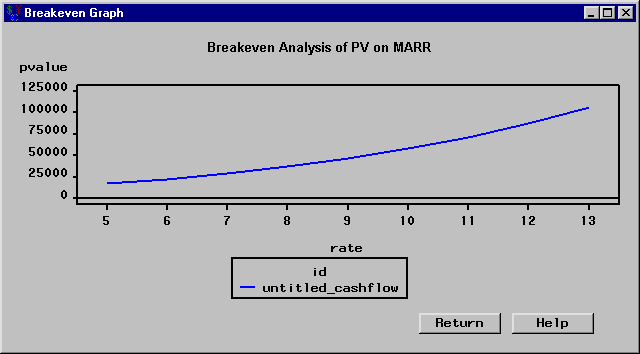
The following item is displayed:
Return takes you back to the Breakeven Analysis dialog box.
Copyright © 2008 by SAS Institute Inc., Cary, NC, USA. All rights reserved.