Creating a Correlation Analysis

Overview

The Correlations transformation generates one of the following types of correlation statistics:
  • Hoeffding
  • Kendall
  • Pearson
  • Spearman
The Correlations transformation is based on the CORR procedure, which is documented in the Base SAS Procedures Guide: Statistical Procedures. The CORR procedure computes Pearson correlation coefficients, three nonparametric measures of association, and the probabilities associated with these statistics. The correlation statistics include the following:
  • Pearson product-moment correlation
  • Spearman rank-order correlation
  • Kendall's tau-b coefficient
  • Hoeffding's measure of dependence, D
  • Pearson, Spearman, and Kendall partial correlation
Pearson product-moment correlation is a parametric measure of a linear relationship between two variables. For nonparametric measures of association, Spearman rank-order correlation uses the ranks of the data values and Kendall's tau-b uses the number of concordances and discordances in paired observations. Hoeffding's measure of dependence is another nonparametric measure of association that detects more general departures from independence. A partial correlation provides a measure of the correlation between two variables after controlling the effects of other variables.
You can specify which columns are correlated and which columns are analyzed. You can group rows in the output based on the values in specified grouping columns. Output appears in a target table or in the Output tab in the process designer. ODS output in the form of HTML, PDF, or RTF can also be sent to a folder on the SAS Application Server that executes the job or to any folder that is accessible to that SAS Application Server.
The target receives data only for the source columns that are involved in the correlation. The target requires two columns that the Correlations transformation populates: _TYPE_ specifies the type of the statistic and _NAME_ identifies the correlation column.
The Correlations transformation requires that grouping columns be sorted in ascending order in the source. If you specify grouping columns, you can sort those columns before the Correlations transformation by using a SAS Sort transformation.

Problem

You want to use the CORR procedure to generate a correlation analysis.

Solution

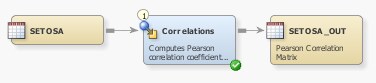
You can use the Correlations transformation in a job that generates a correlation analysis and creates an ODS document that contains its results. This transformation 
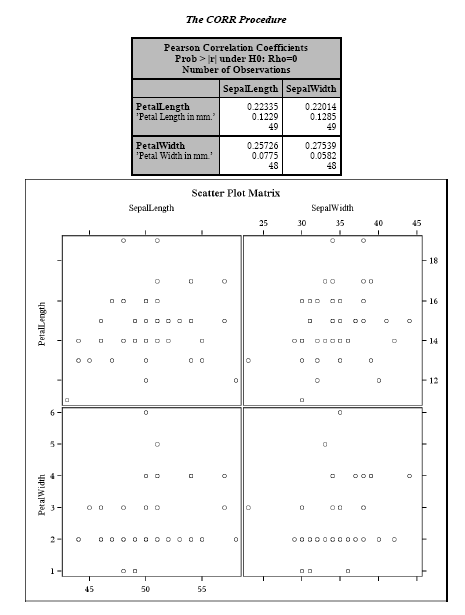
uses the CORR procedure to compute Pearson correlation coefficients, three nonparametric measures of association, and the probabilities associated with these statistics. For example, you can create a job 
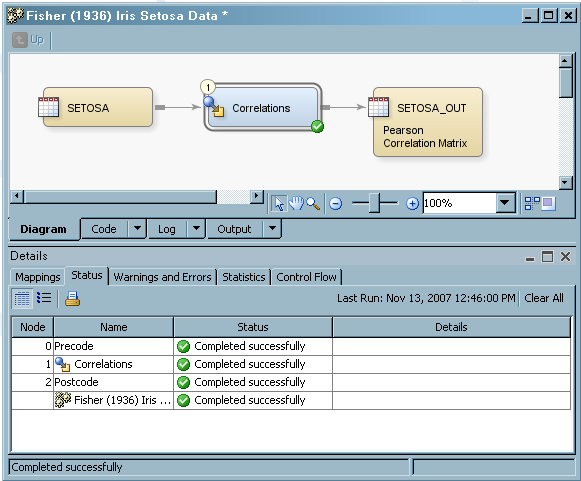
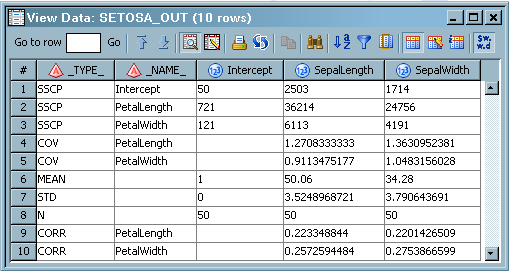
similar to the sample job featured in this topic. Note that the output for this job is sent to a target table, the Output tab in the Job Editor window, and an ODS document that is configured in the job. This sample job generates a correlation analysis that is based on a table of botanical data. The sample job includes the following tasks:

Tasks

Create and Populate the Job

Perform the following steps to create and populate the job:
  1. Create an empty SAS Data Integration Studio job.
  2. Select and drag a Correlations transformation from the Analysis folder in the Transformations tree. Then, drop it in the empty job on the Diagram tab in the Job Editor window.
  3. Select and drag the source table from the Inventory tree. Then, drop it before the Correlations transformation on the Diagram tab.
  4. Drag the cursor from the source table to the input port of the Correlations transformation. This action connects the source to the transformation.
  5. Right-click the Correlations transformation, and click Add Output Port from the Ports option in the drop-down menu. This step enables you to add an output port to the transformation.
    Note: If you want multiple statistical output tables, you must first set the correct number of tables in the Output data window in the Options tab of the Properties window. Once you have set the number of tables in the Output data window, add the same number of output ports to the transformation.
  6. Select and drag the source table from the Inventory tree. Then, drop it after the Correlations transformation on the Diagram tab.
  7. Drag the cursor from the Correlations transformation output port to the target table. This action connects the target to the transformation.
The following display shows a sample process flow diagram for a job that contains the Correlations transformation:
Sample Process Flow
Sample Process Flow
Note that the source table for the sample job is named SETOSA and that the target table is named SETOSA_OUT.

Configure Analytical Options

Use the Options tab in the properties window for the Correlations transformation to configure the output for your analysis. Note that the Options tab is divided into two parts, with a list of categories on the left-hand side and the options for the selected category on the right-hand side. Perform the following steps to set the options that you need for your job:
  1. Open the properties window for the Correlations transformation in the Diagram tab in the Job Editor window. Then, click the Options tab.
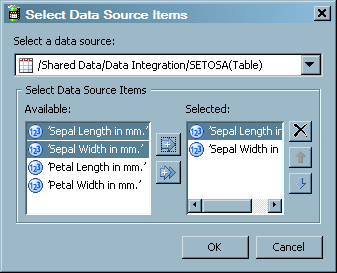
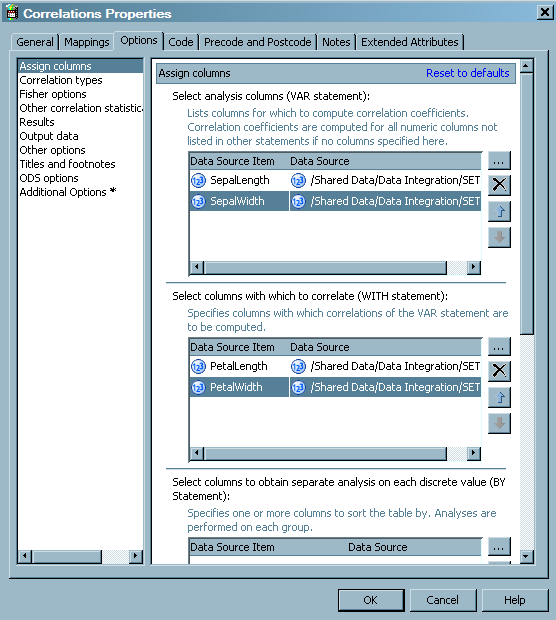
  2. Click Assign columns to access the Assign columns page. Use the column selection prompts to access the columns that you need for your job. For example, you can click Column Selection for the Select analysis columns (VAR statement) to access the Select Data Source Items window, as shown in the following display:
    Sample Select Data Source Items Window
    Sample Select Data Source Items Window
    In the sample job, the VAR statement columns are SepalLength and SepalWidth. The column assignment options are shown in the following display:
    Sample Options Properties
    Sample Options Properties
  3. Note that you must select the other columns that you need for your job, such as the PetalLength and PetalWidth columns in the WITH statement required for the sample job.
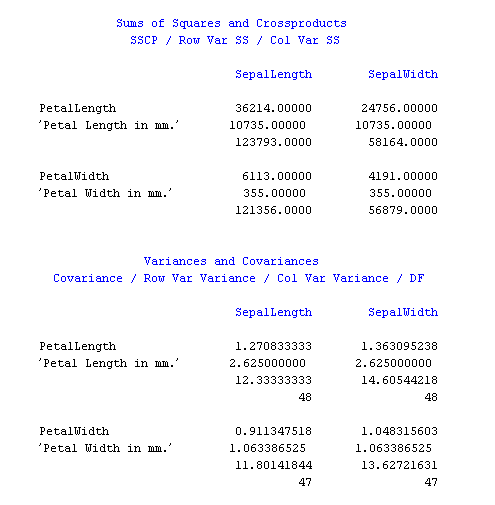
  4. Set the remaining options for your analysis in the appropriate fields. The sample job keeps the default Pearson product-moment correlation type and adds the COV and SSCP options on the Correlation type page. These options are enabled when you select Yes in the drop-down menu for the field and disabled when you select No.
  5. Set any necessary options on the remaining analytical options pages. For example, the Update the metadata for the target tables option on the Additional Options page is enabled and default options for the Fisher options, Other correlation statistical options, Output data, Results, and Other options pages are retained. A reporting option is also set on the Other correlation statistical options page.

Configure Reporting Options

Use the remaining option pages to create and save a report that is based on the analysis conducted in the job. Perform the following steps to set the reporting options:
  1. Click Titles and footnotes to access the Titles and footnotes page and enter up to three headings and two footnotes.
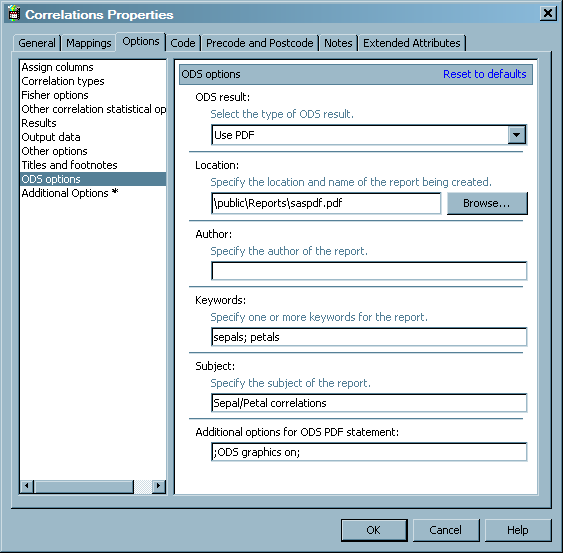
  2. Click ODS options to access the ODS options page. You can choose between HTML, RTF, and PDF output and enter appropriate settings for each. The sample job uses PDF output. Therefore, a location, a set of keywords, the subject of the report, and code to enable ODS graphics are added to the fields that are displayed when Use PDF is selected in the ODS Result field. (The path specified in the Location field is relative to the SAS Application Server that executes the job.) These fields are shown in the following display:
    Sample ODS Options
    Sample ODS Options
    Note: The plots for descriptive statistics option in the Plots option (PLOTS) field on the Other correlation statistical options page is also enabled. This step enables the inclusion of a scatter plot matrix in the PDF output.
  3. Click OK to save the settings for the Options tab.

Run the Job and View the Output

Perform the following steps to run the job and view the output:
  1. Right-click on an empty area of the job, and click Run in the pop-up menu. SAS Data Integration Studio generates code for the job and submits it to the SAS Application Server for execution. The following display shows a successful run of a sample job:
    Successfully Completed Sample Job
    Successfully Completed Sample Job
  2. If error messages are displayed on the Status tab, read and respond to the messages as needed.
  3. To view the correlation analysis, click the Output tab in the Job Editor window. The following display shows the analysis for the sample job:
    Sample Output in the Output Tab
    Sample Output in the Output Tab
  4. To view the target table, right-click the target and select Open. The following display shows the target table data for the sample job:
    Sample Target Table Data
    Sample Target Table Data
  5. Open the PDF document that you created and saved earlier. The following display illustrates a sample report based on the correlations data:
    Sample PDF Output
    Sample PDF Output