About Impact Analysis and Reverse Impact Analysis
Overview
Impact analysis identifies the tables, columns, jobs,
and transformations that are affected by a change to a selected table
or column. Reverse impact analysis identifies the tables, columns,
jobs, and transformations that contribute to the content of a selected
table or column. Use impact analysis before changing or deleting a
metadata object, to see how that change can affect other objects.
Use reverse impact analysis to trace the source data that contributes
to the content of a selected table or column.
The following figure
shows the difference between impact analysis and reverse impact analysis
for a selected object.
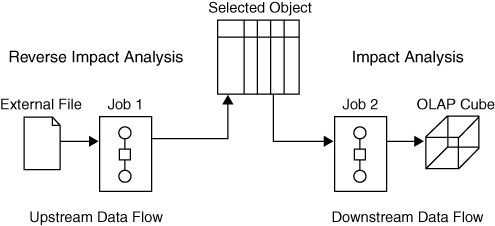
As shown in the figure,
impact analysis traces the impact of the selected object on later
objects in the data flow. Reverse impact analysis traces the impact
that previous objects in the data flow have had on the selected object.
Analysis is performed
on all metadata repositories on the current metadata server. Analysis
extends into cubes. You can generate impact and reverse impact analyses
for most types of data objects, including columns, tables, external
files, information maps, reports, stored processes, Enterprise Guide
projects and associated objects, and the levels and measures in OLAP cubes.
You can also generate impact analyses for generated transformations,
as described in Performing Impact Analysis on a Generated Transformation.
To perform an analysis,
right-click an object in the Inventory tree, Custom tree, or Job Editor
and select Analyze. This action opens a new
window that contains up to four tabs, which include Impact Analysis,
Reverse Impact Analysis, Contents, and Reports. Analytical results
appear in the Impact Analysis or Reverse Impact Analysis tabs. In
those tabs, you can right-click on the table and select Analyze
Columns to determine how that table or job impacts or
is impacted by the selected object. Within these tabs, you can also
display properties or select Open to view
the data in a table. You can also select one of the icons at the top
of the tab to view the object in a tree or diagram view or to print
the contents.
If you run an analysis
and the results do not include objects that you know exist on the
system, ask your administrator to verify that you have the appropriate
privileges to see these objects. For more information, the administrator
should see the SAS Intelligence Platform: Security Administration
Guide.
Extending Impact Analysis to DataFlux Web Studio
You can export the lineage
metadata associated with one or more SAS Data Integration Studio jobs.
This metadata can be imported into the Business Data Network portion
of DataFlux Web Studio (release 2.4 and later). See Working with DataFlux Business Data Network for more information.
DataFlux Web Studio users can then associate the imported data to
Business Data Network terms and view the relationships through the
Relationship Diagram feature of Business Data Network. For information
about viewing relationships in relationship diagrams, see the “Importing
Relationship Data and Reviewing Relationships” section of the
“Business Data Network” chapter in the DataFlux
Web Studio: Users Guide.
Copyright © SAS Institute Inc. All rights reserved.