Creating a Summary Tables Report from Table Data

Overview

You can use a Summary Tables transformation as an interface to the TABULATE procedure. The TABULATE procedure displays descriptive statistics in tabular format, using some or all of the variables in a data set. You can create a variety of tables ranging from simple to highly customized. It computes many of the same statistics that are computed by other descriptive statistical procedures such as MEANS, FREQ, and REPORT.
The TABULATE procedure provides the following:
  • simple but powerful methods to create tabular reports
  • flexibility in classifying the values of variables and establishing hierarchical relationships between the variables
  • mechanisms for labeling and formatting variables and procedure-generated statistics
It displays descriptive statistics in tabular format, using some or all of the variables in a data set. You can create a variety of tables ranging from simple to highly customized.

Problem

You want to print a tabular report of summary data from a data table.

Solution

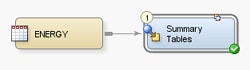
You can use the Summary Tables transformation in a job that generates a tabulated data and creates an ODS document that contains the results. This transformation uses the TABULATE procedure to display descriptive statistics in tabular format, using some or all of the variables in a data set. For example, 
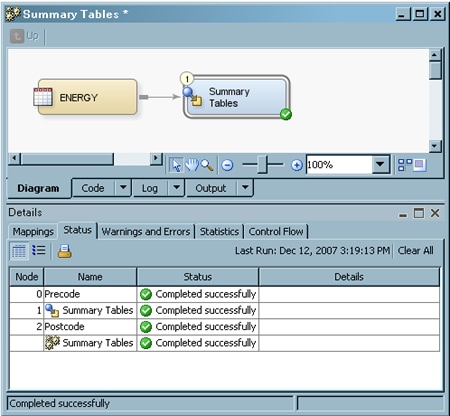
you can create a job similar to the sample job featured in this topic. 
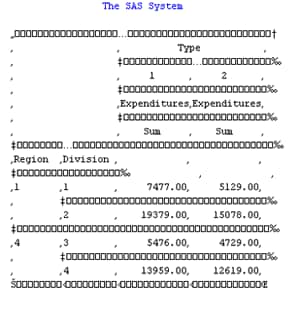
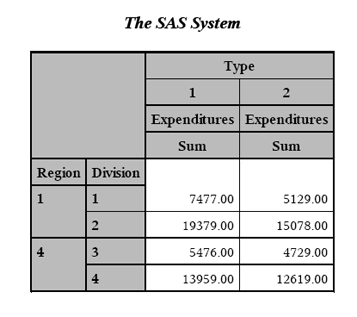
This sample job creates a table that contains summary information about energy consumption. Note that the output for this job is sent to the Output tab in the Job Editor window and an ODS document that is configured in the job. The sample job includes the following tasks:

Tasks

Create and Populate the Job

Perform the following steps to create and populate the job:
  1. Create an empty SAS Data Integration Studio job.
  2. Select and drag a Summary Tables transformation from the Analysis folder in the Transformations tree. Then, drop it in the empty job on the Diagram tab in the Job Editor window.
  3. Select and drag the source table out of the Inventory tree. Then, drop it before the Summary Tables transformation on the Diagram tab.
  4. Drag the cursor from the source table to the input port of the Summary Tables transformation. This action connects the source to the transformation.
  5. Right-click the Summary Tables transformation, and click Add Output Port from the Ports option in the drop-down menu. This step enables you to add an output port to the transformation.
  6. Select and drag the source table from the Inventory tree. Then, drop it after the Summary Tables transformation on the Diagram tab.
  7. Drag the cursor from the Summary Tables transformation output port to the target table. This action connects the target to the transformation.
Sample Process Flow
Sample Process Flow
Note that the source table for the sample job is named ENERGY.

Configure Analytical Options

Use the Options tab in the properties window for the Summary Tables transformation to configure the SAS tables that are generated in the job and shape the output of your analysis. Note that the Options tab is divided into two parts, with a list of categories on the left-hand side and the options for the selected category on the right-hand side. Perform the following steps to set the options that you need for your job:
  1. Open the properties window for the Summary Tables transformation in the Diagram tab in the Job Editor window. Then, click the Options tab.
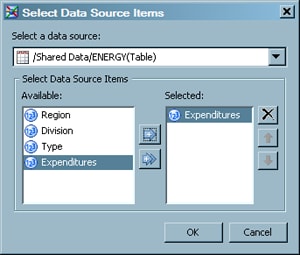
  2. Click Assign columns to access the Assign columns page. Use the column selection prompts to access the columns that you need in the SAS tables generated in your job. For example, you can click Column Selection for the Select analysis columns (VAR statement) to access the Select Data Source Items window, as shown in the following display.
    Sample Select Data Source Items Window
    Sample Select Data Source Items Window
    In the sample job, the VAR statement column is Expenditures.
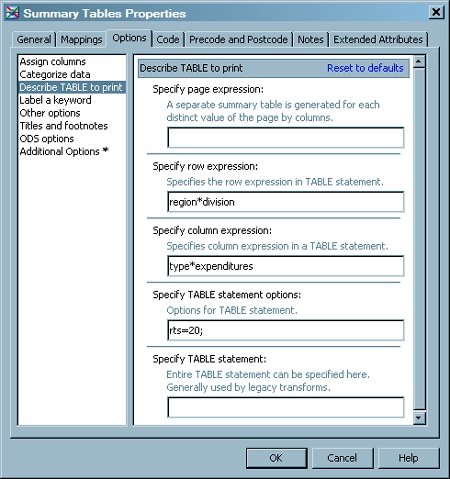
  3. Set additional analytical options as needed. For example, the sample job has three CLASS statement columns, which are Region, Division, and Type. These columns are specified in the Select columns to subgroup data (CLASS statement) field on the Categorize data page. The TABLE statement options are set on the Describe TABLE to print page, as shown in the following display:
    Sample TABLE Statement Options
    Sample TABLE Statement Options
    Note that separate options are set for the row expression, the column expression, and the TABLE statement as a whole. Taken together, these options define the table that is generated by the job and control how it is formatted.

Configure Reporting Options

Use the remaining option pages to create and save a report based on the analysis conducted in the job. Perform the following steps to set the reporting options:
  1. Click Title and footnotes to access the Title and footnotes page and enter up to three headings and two footnotes.
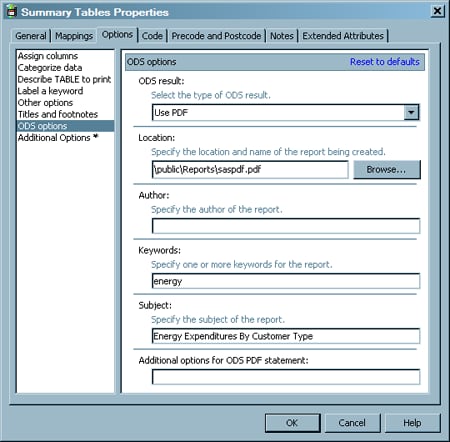
  2. Click ODS options to access the ODS options page. You can choose between HTML, RTF, and PDF output and enter appropriate settings for each. The sample job uses PDF output. Therefore, a location, a set of keywords, the subject of the report, and code to enable ODS graphics are added to the fields that are displayed when Use PDF is selected in the ODS Result field. (The path specified in the Location field is relative to the SAS Application Server that executes the job.)
    Sample ODS Options
    Sample ODS Options
    Note: You can set additional reporting and formatting options in the Specify other options for OPTIONS statement field on the Other options page. For example, the following options are set for the sample job:
    options nodate pageno=1 linesize=64 pagesize=40;
  3. Click OK to save the settings for the Options tab.

Run the Job and View the Output

Perform the following steps to run the job and view the output:
  1. Right-click on an empty area of the job, and click Run in the pop-up menu. SAS Data Integration Studio generates code for the job and submits it to the SAS Application Server for execution. The following display shows a successful run of a sample job.
    Successfully Completed Sample Job
    Successfully Completed Sample Job
  2. If error messages are displayed on the Status tab, read and respond to the messages as needed.
  3. To view the summary table created in the job, click the Output tab in the Job Editor window. The following display shows the analysis for the sample job.
    Sample Output
    Sample Output
  4. Open the PDF document that you created and saved earlier. The following display shows the summary table generated by the sample job.
    Sample PDF Output
    Sample PDF Output