Cluster Profiling
To explore clusters,
use the DM Example-1 branch, which starts
with the DM Example-1 node and ends with
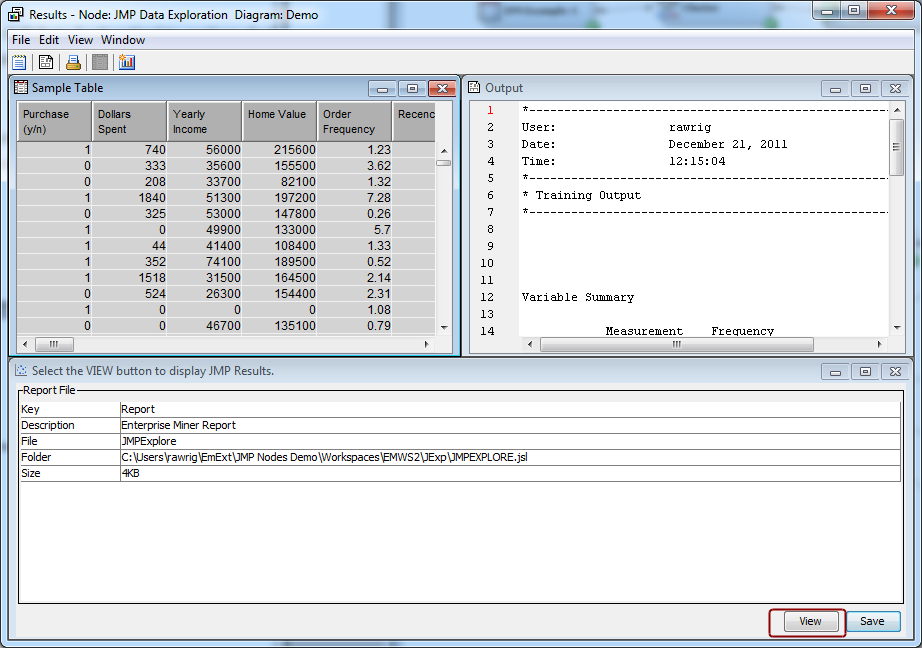
the JMP Data Exploration node. The JMP
Data Exploration node explores clusters using the JMP
Graph Builder and the mapping capabilities provided by JMP. Follow
the steps below to examine the results of the DM Example-1 branch.
-
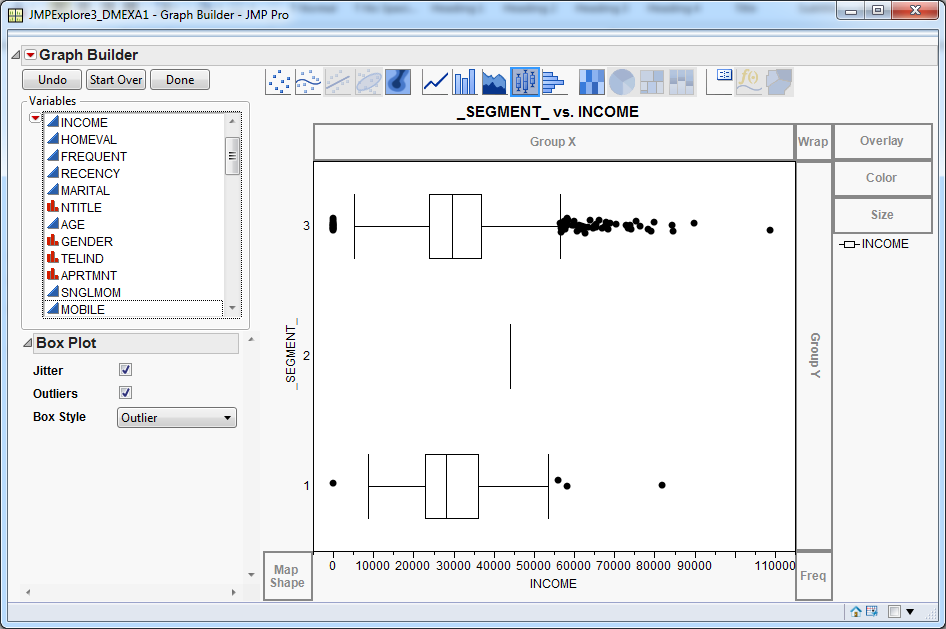
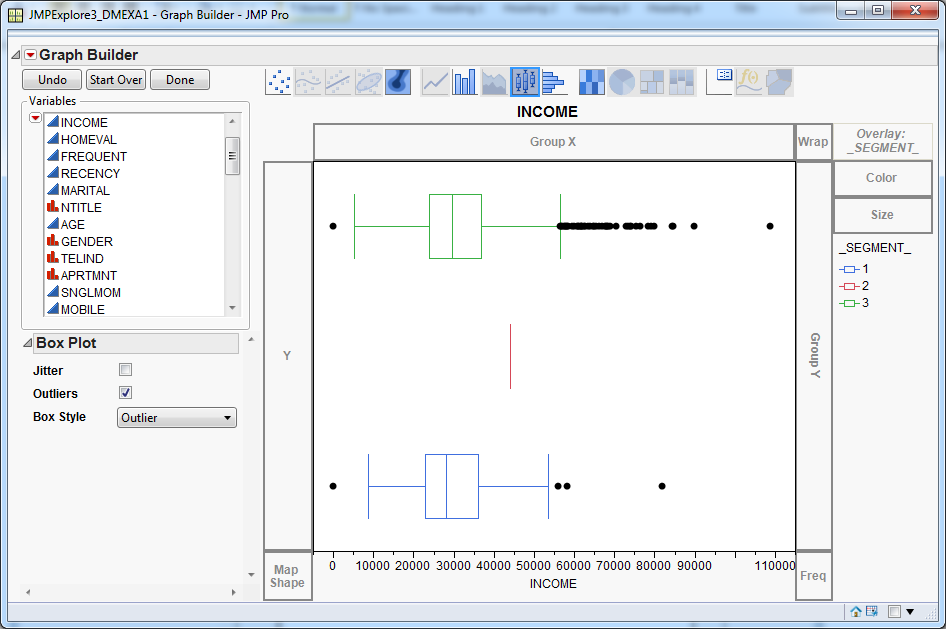
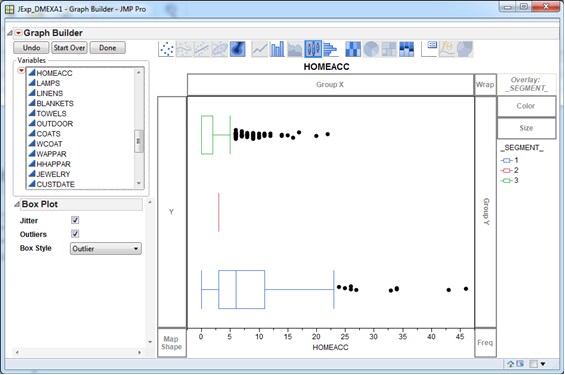
In the Variables list, select _Segment_ and drag it to the Y-axis. Next, select the variable INCOME and drag it to the X-axis. You should see a cluster profile plot that is similar to the one below.Alternatively, if you select the Overlay option in the upper right corner of the Graph Builder window, the _SEGMENT_ variable is used as an overlay variable.Both versions of the chart suggest that income is not a strong differentiator of the clusters. Segments 1 and 3 have similar interquartile ranges. Segment 2 has a higher median than the other segments, but it represents only one customer.