Create a Data Source
To use sample data that is stored in a SAS data set in a SAS Enterprise Miner project, you need to define a data source. In SAS Enterprise Miner, a data source stores
the metadata of an input data set.
Tip
You can also use input data
saved in files (with extensions such as .jmp and .csv) that are not
SAS data sets in a process flow. To import an external file into a
process flow diagram, use the File Import node, which
is located on the Sample tab on the Toolbar.
To create a new data
source for the sample
data:
-
-
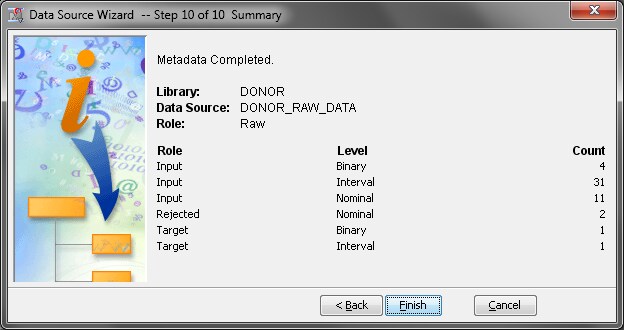
Change the value of Role for the variables to match the description below. Then, click Next.To change an attribute, click on the value of that attribute and select from the drop-down menu that appears.
-
CONTROL_NUMBER should have the Role ID.
-
TARGET_B should have the Role Target.
-
TARGET_D should have the Role Rejected.
-
All other variables should have the Role Input.
Note: SAS Enterprise Miner automatically assigns the roleTargetto any variable whose name begins with the prefix TARGET_. For more information about the rules that SAS Enterprise Miner uses to automatically assign roles, see the SAS Enterprise Miner Help. -
-
Select the Yes option button to indicate that you want to build models based on the values of decisions. Click Next.
-
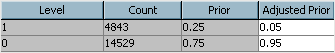
On the Prior Probabilities tab, select the Yes option button to indicate that you want to enter new prior probabilities. In the Adjusted Prior column of the table, enter
0.05for Level 1 and0.95for Level 0.The values in the Prior column reflect the proportions of observations in the data set for which TARGET_B is equal to 1 and 0 (0.25 and 0.75, respectively). However, as the business analyst, you know that these proportions resulted from over-sampling of donors from the 97NK solicitation. In fact, you know that the true proportion of donors for the solicitation was closer to 0.05 than 0.25. For this reason, you adjust the prior probabilities. -
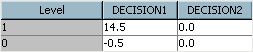
On the Decision Weights tab, the Maximize option button is automatically selected, which indicates that you want to maximize profit in this analysis.Enter
14.5as the Decision 1 weight for Level 1,-0.5as the Decision 1 weight for Level 0, and0.0as the Decision 2 weight for both levels. Click Next.In this example, Decision 1 is the decision to mail a solicitation to an individual. Decision 2 is the decision to not mail a solicitation. If you mail a solicitation, and the individual does not respond, then your cost is $0.50 (the price of postage). However, if the individual does respond, then based on the previous solicitation, you expect to receive a $15.00 donation on average. Less the $0.50 postage cost, your organization expects $14.50 profit. If you do not mail a solicitation, you neither incur a cost nor expect a profit. These numbers are reflected in the decision weights that you entered in the table.Click Next.
-
Copyright © SAS Institute Inc. All rights reserved.