Analyze with a Neural Network Model
Neural networks are a class of parametric models that can accommodate a wider variety
of nonlinear relationships between a set of predictors and a target variable than can logistic regression. Building a neural network model involves two main phases. First, you must define the network configuration. You can
think of this step as defining the structure of the model that you want to use. Then,
you iteratively train the model.
A neural network model will be more complicated to explain to the management of your
organization than a
regression or a decision tree. However, you know that the management would prefer
a stronger predictive model, even if it is more complicated. So, you decide to run
a neural network model, which you will compare to the other models later in the example.
Because neural networks are so flexible, SAS Enterprise Miner has two nodes that fit
neural network models: the Neural Network node and the AutoNeural node. The Neural
Network node
trains a specific neural network configuration; this node is best used when you know
a lot about the structure of the model that you want to define. The AutoNeural node
searches over several network configurations
to find one that best describes the relationship in a data set and then trains that network.
This example does not
use the AutoNeural node. However, you are encouraged to explore the
features of this node on your own.
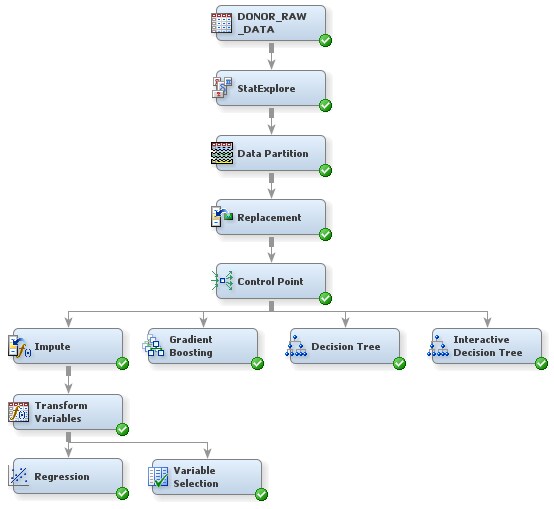
Before creating a neural network, you will reduce the number of input variables with
the Variable Selection node.
Performing variable selection reduces the number of input variables and saves computer resources. To
use the Variable Selection node to reduce the number of input variables that are used
in a neural network:
-
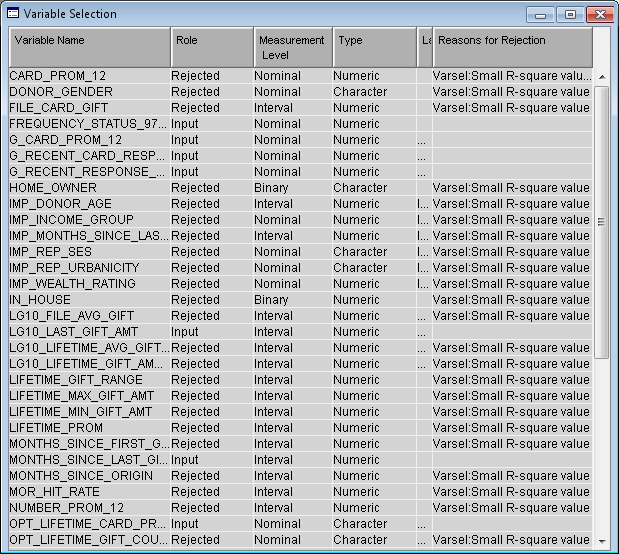
Examine the table to see which variables were selected. The role for variables that were not selected has been changed to
Rejected. Close the Results window.Note: In this example, for variable selection, a forward stepwise least squares regression method was used. It maximizes the model R-square value. For more information about this method, see the SAS Enterprise Miner Help.
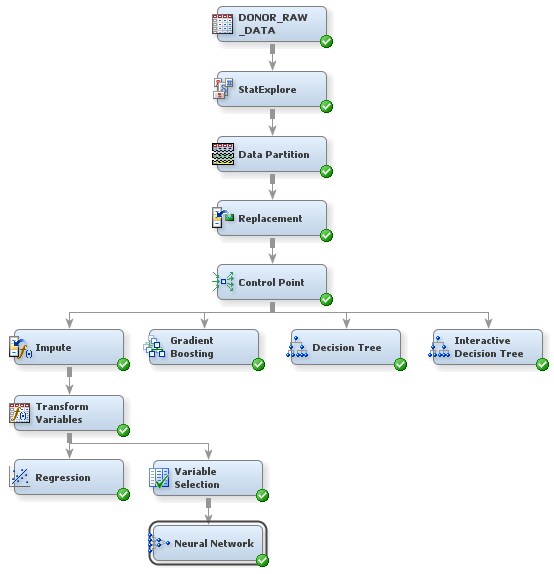
The input data is now ready to be modeled with a neural network. To use the Neural
Network node to train a specific neural network configuration:
-
Select the Neural Network node. In the Properties Panel, scroll down to view the Train properties, and click on the ellipses that represent the value of Network. The Network window appears. For more information about neural networks, connections, and hidden units, see the Neural Network Node: Reference documentation in SAS Enterprise Miner help.Change the following properties:
-
Click on the value of Direct Connection and select Yes from the drop-down menu that appears. This selection enables the network to have connections directly between the inputs and the outputs in addition to connections via the hidden units.
-
Click on the value of Number of Hidden Units and enter
5. This example trains a multilayer perceptron neural network with five units on the hidden layer.
Click OK. -
-
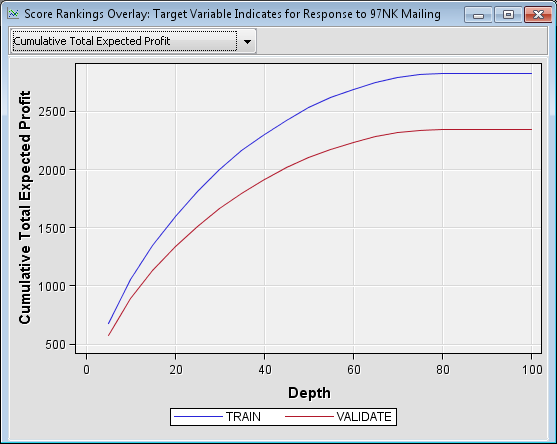
In the window that appears when processing completes, click Results. The Results window appears. Maximize the Score Rankings Overlay window. From the drop-down menu, select Cumulative Total Expected Profit.Compare these results to those from the Regression node. According to this model, if you were to solicit the best 40% of the individuals, the total expected profit from the validation data would be approximately $1900. If you were to solicit everyone on the list, then based on the validation data, you could expect approximately $2350 profit on the campaign.
Tip
See “Predictive Modeling with SAS Enterprise Miner: Practical
Solutions for Business Applications”
for examples that use the Impute, Transform Variables, and Neural
Network nodes, as well as a business application of a logistic regression
model.
Copyright © SAS Institute Inc. All rights reserved.