To use
the MultiPlot node to graphically discover patterns and trends in the input
data, complete the following steps:
-
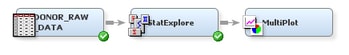
From the
Explore tab on the Toolbar, select the MultiPlot node
icon. Drag the node into the Diagram Workspace.
-
Connect
the StatExplore node to the MultiPlot node.
-
Select
the MultiPlot node. In the Properties Panel, scroll down to view the
Train properties. Click on the value of
Type of Charts, and select
Both from the drop-down menu
that appears. Changing the selection causes SAS Enterprise Miner to
produce both scatter plots and bar charts when you run the node.
-
In the
Diagram Workspace, right-click the MultiPlot node, and select
Run from the resulting menu. Click
Yes in the confirmation window that opens.
-
In the
window that appears when processing completes, click
Results. The Results window opens.
-
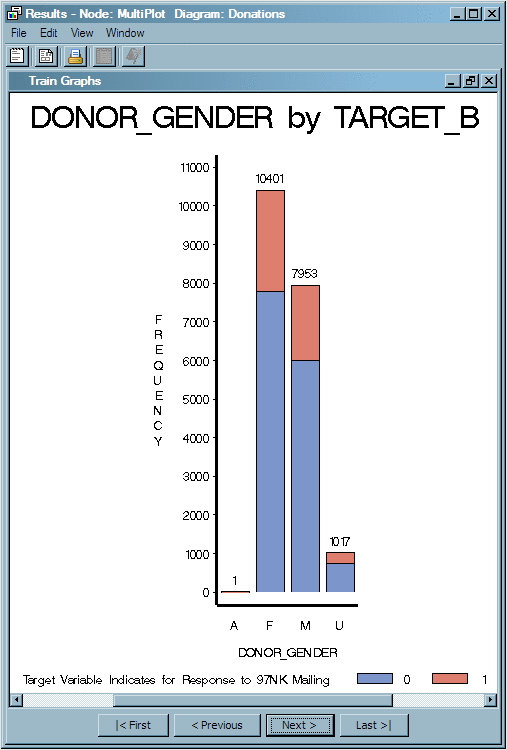
Maximize
the Train Graphs window. This window displays a bar chart and a scatter
plot for each variable. You can use the buttons at the bottom of the
window to scroll through the plots.
Note: The MultiPlot
node uses all observations in the input data set, rather than a sample
of the observations, for plotting.
Notice
these results in the bar charts:
-
One value for the variable DONOR_GENDER
is incorrectly recorded as an A.
-
There are several heavily skewed
variables (for example FILE_AVG_GIFT and LIFETIME_AVG_GIFT_AMT). Often,
a log transformation is used to correct skewness.
Notice
in the scatter plots that increasing values of some variables (for
example RECENT_RESPONSE_PROP and LIFETIME_GIFT_AMOUNT) tend to be
more associated with the target variable (they are also heavily skewed).
For these variables, you might want to consider an optimal binning
transformation.
Later
in the example, you will address these data issues.
-
Close
the Results window.
Tip
The MultiPlot
node automatically generates a series of plots and graphs. You can
also generate ad hoc, custom reports by using the Graph Explorer node.