Because
the AutoNeural node searches over several network configurations,
its calculations require more computer resources than those of the
Neural Network node. Therefore, you decide to first perform preliminary
variable selection before you automatically select and train a neural
network.
To use
the Variable Selection node to reduce the number of input variables
that are used in a neural network:
-
Select
the
Explore tab on the Toolbar.
-
Select
the Variable Selection node icon. Drag the node into the Diagram Workspace.
-
Connect
the Transform Variables node to the Variable Selection node.
-
In the
Diagram Workspace, right-click the Variable Selection node, and select
Run from the resulting menu. Click
Yes in the confirmation window that opens.
-
In the
window that appears when processing completes, click
Results. The
Results window opens.
-
Expand
the
Variable Selection window.
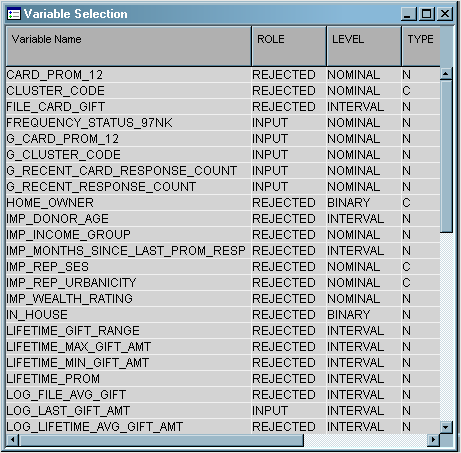
Examine
the table to see which variables were selected. The role for variables
that were not selected has been changed to
Rejected. Close the
Results window.
Note: In this example,
for variable selection, a forward stepwise least squares regression
method was used that maximizes the model R-square value. For more
information about this method, see the SAS Enterprise Miner Help.
To use
the AutoNeural node to search for and train an optimal neural network
configuration, complete the following steps:
-
Select
the
Model tab on the Toolbar.
-
Select
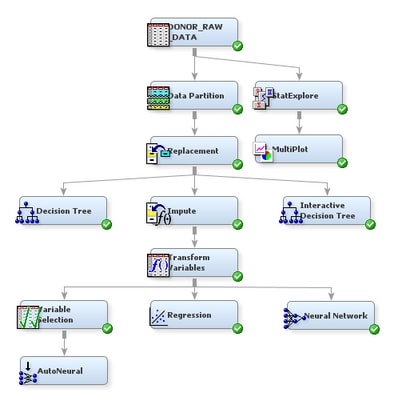
the AutoNeural node icon. Drag the node into the Diagram Workspace.
-
Connect
the Variable Selection node to the AutoNeural node.
-
Select
the AutoNeural node. In the Properties Panel, scroll down to view
the Train properties:
-
Click on the value of the model
option
Architecture and select
Cascade from the drop-down menu that appears. This action causes SAS Enterprise
Miner to train only cascade network models.
-
Click on the value of the model
option
Train Action and select
Search. This action causes SAS Enterprise Miner to perform a search to
find the best of the candidate network models.
-
In the
Diagram Workspace, right-click the AutoNeural node, and select
Run from the resulting menu. Click
Yes in the confirmation window that opens.
-
In the
window that appears when processing completes, click
Results. The
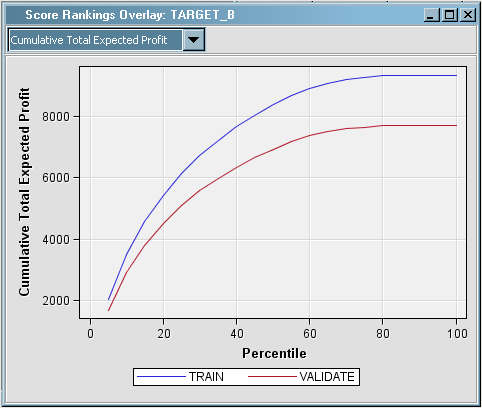
Results window opens. Maximize the
Score Rankings Overlay window. From the drop-down menu,
select
Cumulative Total Expected Profit.
Again,
compare this plot to the plots for the other two models. The shape
of the curve is similar for this model to that of the
curve for both other models. However, the range of cumulative total
expected profit is considerably larger on this plot.
For example,
if you were to solicit the best 40% of the individuals, the total
expected profit from the validation data would be around $6250. Soliciting
all of the individuals yields a cumulative total expected profit of
about $8900.
-
Close
the
Results window.


