Champion and Challenger Performance Reports
About the Champion and Challenger Performance Report
After
you execute a performance definition for the champion model, you can
execute a performance definition for the challenger model using the
same performance data sets. SAS Decision Manager updates
the output data sets with the performance data for the challenger
model. You can create a Champion and Challenger Performance report
that compares the performance of the two models.
The Champion and Challenger
Performance report contains these charts:
Number of Predictors Exceeding Deviation Threshold
This characteristic
report creates a chart for each index that exceeds a deviation threshold
(either 0.1 or 0.25) as indicated in the define performance definition.
The characteristic report detects shifts in the distribution of input
variables over time.
Lift Trend Chart
A Lift Trend chart
displays the cumulative lift of the champion model over time.
Gini - Trend
When the Gini - ROC
Chart is created, the Gini index for each ROC curve is also created.
The Gini coefficient represents the area under the ROC curve and is
a benchmark statistic that can be used to summarize the predictive
accuracy of a model. The Gini - Trend Chart plots a model's Gini index
scores over time, and these are used to monitor model degradation
over time.
Gini - ROC Chart
Sensitivity is the
proportion of true positive events, and specificity is the proportion
of true negative events. The Gini - ROC Chart plots Sensitivity on
the Y axis and 1 - Specificity on the X axis.
KS Trend Chart
When you create a Kolmogorov-Smirnov
report, the KS statistic and the corresponding probability cutoff
are computed for each Kolmogorov-Smirnov table. The KS Trend Chart
uses a summary data set that plots the KS Statistic and the probability
cutoff values over time. The KS Trend Chart is used to monitor model
degradation over time.
KS Chart
The KS Chart uses the
Kolmogorov-Smirnov statistic to measure the maximum vertical separation,
or deviation between the cumulative distributions of events and non-events.
Score Histogram
The Score Histogram
compares the scoring result distribution at different time periods
using a histogram.
Score Distribution Line Plot
The Score Distribution
Line Plot compares the scoring result distribution at different time
periods using a line plot.
Before you create a
Champion and Challenger Performance report, verify the performance
data and model status.
Verify Performance Data and Model Status
Before you can create
a Champion and Challenger Performance report:
-
Select the Models page and verify that a champion model has been set. The champion model is designated as Champion in the Role column. If a champion has not been set, select a model from the list, and click
 to set the model as the project champion model.
-
Ensure that a challenger model is flagged. The challenger model is designated as Challenger in the Role column. If it is not, select a model from the list, and click
 to flag a model as a challenger to the project champion
model.
to flag a model as a challenger to the project champion
model.
-
Verify that performance monitoring data is available for the champion model and the challenger model. Performance monitoring results must exist for the same performance data using the same time periods and data labels. Navigate to Performance
 Results Data Sets and select the file jobstatus.sas7bdat.
The Content tab displays performance monitoring
status data.
Results Data Sets and select the file jobstatus.sas7bdat.
The Content tab displays performance monitoring
status data.
-
Verify that the UUIDs for the champion and challenger models are in the Model UUID column.
-
Using the name column and the time column, verify that matching date labels exist for the champion and challenger models for each type of report. If there are multiple date labels for a model for any given report, SAS Decision Manager uses the most recent job.
-
Create a Champion and Challenger Performance Report
To create a champion
and challenger performance report:
-
Click
 and select Champion and Challenger Performance.
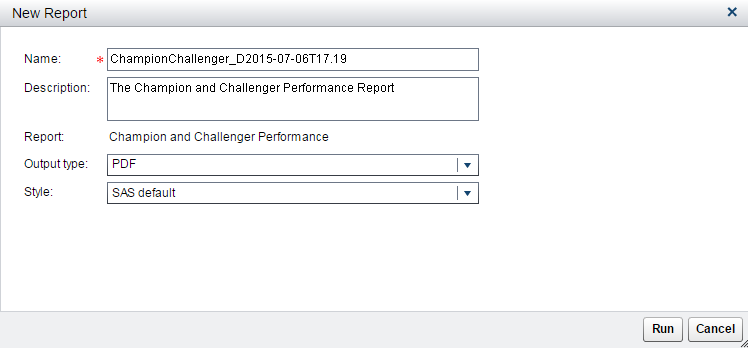
The New Report window appears.
and select Champion and Challenger Performance.
The New Report window appears.
-
Enter a name and description if you do not want to use the default values.
-
Select an output type. The default is PDF.
-
Select a style for the report. When the SAS default option is selected, the default style and themes are used in generating the report. For example, the SAS default style for the HTML output type is HTMLBLUE.
-
Click Run. The report is generated and appears in the default viewer for the selected output type.
See Also
Copyright © SAS Institute Inc. All Rights Reserved.
Last updated: February 22, 2017