Using an Impact Diagram
You can generate an
impact diagram by running a view that specifies Network
Diagram in the Display type field.
You can access this setting in the properties window for the view.
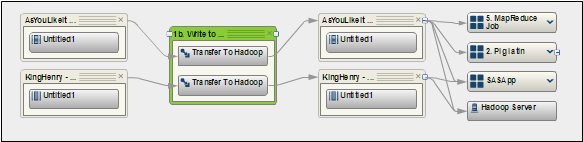
The following display
shows an impact diagram generated by the Impact Analysis view for
the 1b. Write to HDFS job:
Folded Impact Diagram
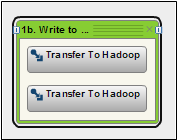
Parent objects in Impact
diagrams have two states, folded and unfolded, that take advantage
of grouping capabilities. The diagrams also support an include relationship.
When a diagram is folded, the included items are displayed inside
a group node that represents the parent item. In this case, the two
Transfer to Hadoop objects are included inside the 1b. Write to HDFS
object. You can unfold the diagram by clicking the Expand controls
on the left and right side of the group object. This action displays
the upstream and downstream objects in the diagram. Upstream objects
come before the diagram subject, and downstream objects come after
the subject.
Unfolded Impact Diagram
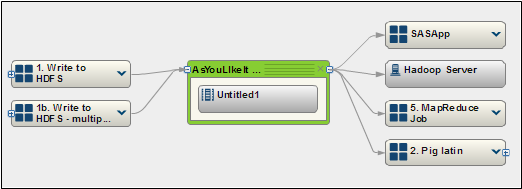
You can also select
an object in the diagram, such as the As You Like It object, to designate
as the subject for a new diagram. You can move the mouse pointer
over any object to view a description of the object and the object
type.
This refocused and
unfolded diagram is displayed in a new tab, as shown in the following
display:
Refocused and Unfolded Impact Diagram
Copyright © SAS Institute Inc. All Rights Reserved.
Last updated: August 7, 2018