Choosing a View
Overview
Once you have selected
a subject of a SAS Lineage diagram, you can choose a view. SAS Lineage
is shipped with the following default views:
All three of these views
are based on information included in the Relationship database that
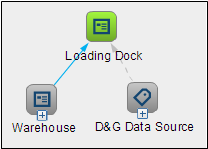
is a part of the Web Infrastructure Platform Data Server. The All
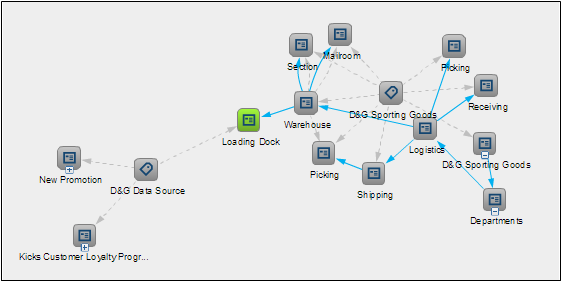
Relationships view displays all the relationships in the Relationship
database for a selected subject item in a network diagram. The Governance
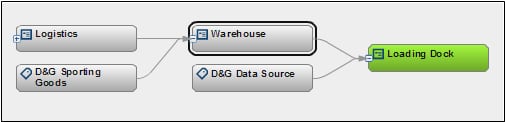
and Impact Analysis views are left-to-right dependency views. These
diagrams display a subject item and all its related items in a left-to-right
dependency view. Items to the left of the subject are considered predecessor or upstream.
Items to the right of the subject are considered successor or downstream.
All relationships in the diagram have a direction and all items related
to the subject are placed either upstream or downstream based on that
direction. These views also have grouping capabilities, so that included
items appear inside a group node that represents the parent item.
The Governance and Impact
Analysis views do not support displaying equivalent nodes for nodes
that are also group nodes. For example, you could have a Job1 that
includes 3 tables and a Job2 that
includes 2 tables. If you create an equivalent relationship between
Job1 and Job2, that equivalent relationship will not show up in Governance
and Impact Analysis views. Equivalent objects that are not group nodes
are displayed in Governance and Impact Analysis views. All equivalent
objects are displayed in All Relationships views.
Governance helps organizations
maintain a single, consistent set of policies and processes for developing,
monitoring and managing corporate data. The Governance view shows
you the data that you need to use capabilities such as data profiling,
data integration, common language creation, and hierarchy management.
The Impact Analysis
view includes SAS Business Data Network terms, but it does not include
the is associated with relationship
to the terms. Impact analysis identifies the tables, columns, jobs,
and transformations that are affected by a change to a selected table
or column. Use impact analysis before changing or deleting a metadata
object to see how that change can affect other objects.

This diagram displays
the hierarchy of the Loading Dock term
and its parent terms.
All of the views handle
related items in the same way. When an item has related items, an Expand button
(+) is available on that item. Click the Expand button
to display that item's related items. This process is repeated
for each item displayed. The subject item in an All Relationships
view initially does not have an Expand button
because it is always expanded when the diagram is brought up.
You can also create
and save custom user-defined views. However, these views cannot be
shared with other users. See
Creating and Managing User-Defined Views for information about user-defined views.
All Relationships
Governance

Copyright © SAS Institute Inc. All rights reserved.