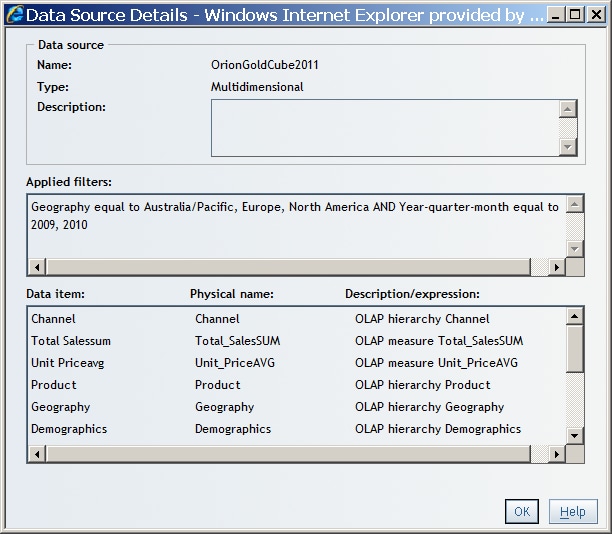
Display Data Source, Data Item, and Filter Details for a Table or a Graph
To display information
about a table or a graph, right-click inside the table or graph, and
then select Data Source Details. The Data
Source Details dialog box contains the following information
about the selected object:
Data source
This section contains
the following information:
Name
This field displays the name of the data source that is being used for this table or graph.
Type
This field displays the type of data source (Relational or Multidimensional).
The data source type determines which options are available for building
and viewing reports.
Description
This field displays a description of the data source, if one is available.
Applied filters
This field displays
the following information:
-
The filters that are applied to the current report section. These filters affect all of the tables and graphs in the section that you are viewing.
-
The filters and rankings that are applied to this table or graph only.
-
The expression that specifies how the filters and rankings are applied.
Note: For synchronized objects,
the Applied filters text refers to the filters
for the object and not the synchronized query.
Data item, Physical name, Description/expression
For each data item in this table or graph, this box lists the name of the data item as it appears in
the data source that was prepared by the data source administrator, the name of the
data item in
the original data source, and either a description (standard data items) or an expression
(calculated data items).
Data Source Details Dialog Box

Copyright © SAS Institute Inc. All Rights Reserved.