Using Custom Data Items in a Query
About Custom Data Items
When a data source does not contain a calculation that you want to use in a query, you can use the measures that are contained in the data source to create a custom
data item. There are two types of custom data items that you can create:
-
You can use one or more measures in a selected data source to create a new calculation. For example, you could create a custom data item called
Profit, which is created by using this expression:[Revenue]-[Cost], whereRevenueandCostare measures in a data source. You also could create this expression:[Total_Retail_Price] / 1000000, whereTotal_Retail_Priceis the measure divided by 1 million. For more information, see Create a Custom Data Item By Entering an Expression. -
If your query includes a time hierarchy from a multidimensional data source, then you can create a custom data item that is based on relative time. For example, you might create these expressions:
Percent change (parallel periods)[Revenue], where[Revenue]is the selected measure, orRolling Total (period to date)[COST_N], where[COST_N]is the selected measure. For more information, see Create a Custom Data Item That Is Based on Relative Time.
Measures used in a custom data item expression are always calculated by using the
default aggregation method. (Within SAS Web Report Studio, it is not possible to produce a detailed
calculation.)
Create a Custom Data Item By Entering an Expression
To create a custom
data item by entering an expression, complete these steps:
-
In the Section Data panel, select Options
 Select Data to open the Select
Data dialog box.
-
Select the Custom tab.
-
A data source is selected by default. If you want to use a different data source, complete these steps:
-
Click Select Data Source.
-
In the Select Data Source dialog box, select a new data source. This also changes the data source for standard data items.
-
Click OK.
-
-
Type the Name of the custom data item. You cannot use these characters:
< > ( ) & # \ -
Type an arithmetic expression into the Expression field. The expression is evaluated based on the aggregated values of the measures that you selected. (Within SAS Web Report Studio, it is not possible to produce a detailed calculation.)The following table contains some items that you can include in an expression.
Items That Can Be Included in a Custom Data Item Expression ItemsExamplesNotesmeasure names, enclosed in square brackets[Profit][Cost of Goods Sold]If you select a measure from the Available measures list box and click to move it to the Expression field,
then the brackets are automatically included.
parentheses
to move it to the Expression field,
then the brackets are automatically included.
parentheses2 * ([COST_N] + [Sales_Cost])Use parentheses when you need to perform a calculation outside of the normal order of operations.1You can type the parentheses or highlight the appropriate part of the expressions and then click .
the following symbols:
.
the following symbols:+(plus sign),-(minus sign),*(multiplication sign), and/(division sign)[Retail_Price] - [Cost]You can type the symbols or use the symbol buttons:


 .
numeric constants
.
numeric constants[Total_Retail_Price] / 1000000You cannot create a data item that is a constant value such as500or500+300.1In the normal order of operations, working from left to right, multiplication and division are performed first, followed by addition and subtraction. -
After you have written the expression, click Add to add your custom data item to the Custom items box. A custom data item displays with this icon:
 .
.
-
Click OK.The custom data item that you created is listed in the Section Data panel with any other selected or created data items.
Create a Custom Data Item That Is Based on Relative Time
If your query includes
a time hierarchy from a multidimensional data source, then you can
create a custom data item that is based on relative time. Complete
these steps:
-
In the Section Data panel, select Options
 Select Data to open the Select
Data dialog box.
-
Select the Custom tab.
-
A data source is selected by default. If you want to use a different data source, complete these steps:
-
Click Change Source.
-
In the Select Data Source dialog box, select a new data source.
-
Click OK.
-
-
Type the Name of the custom data item. You cannot use these characters:
< > ( ) & # \ -
Select a measure in the Available measures field.
-
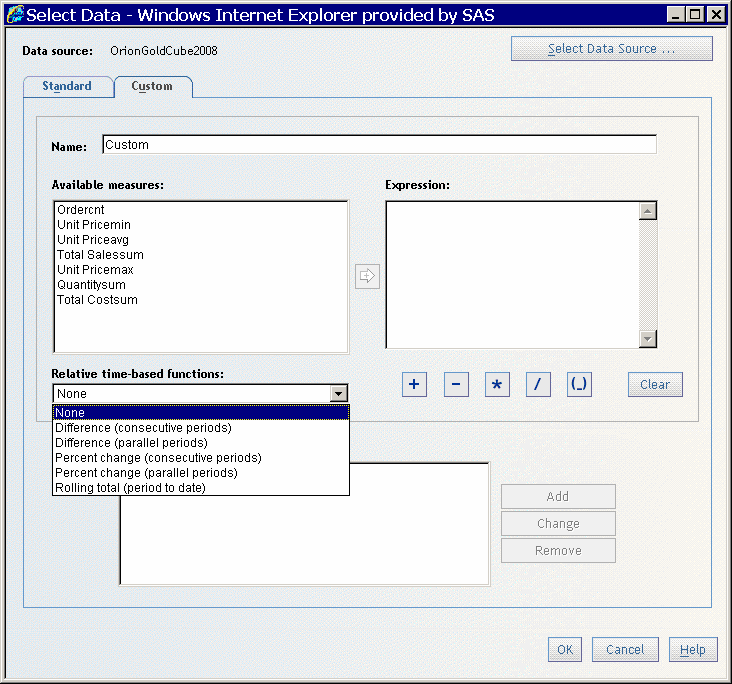
Select one of the options in the Relative time-based functions drop-down list. You can create the following calculations for the selected measure:Difference (consecutive periods)the difference between the previous period and the current period.Difference (parallel periods)the difference between the current period and the equivalent period from the previous year. For example, you might calculate the difference between the third quarter of the current year and the third quarter of the previous year.Percent change (consecutive periods)the difference between the previous period and the current period, expressed as a percentage of the previous period's value.Percent change (parallel periods)the difference between the current period and the equivalent period from the previous year, expressed as a percentage of the previous year's value. For example, you might calculate the percentage change between the third quarter of the current year and the third quarter of the previous year.Rolling Total (period to date)the sum of the values for the current period and all of the preceding periods. (This function starts over with each calendar year.)Relative Time-Based Functions Drop-down List in the Select Data Dialog Box

-
Click
 to place your relative time expression in the Expression field.
The expression is evaluated based on the aggregated values of the
measures that you selected. (Within SAS Web Report Studio, it is not
possible to produce a detailed calculation.)
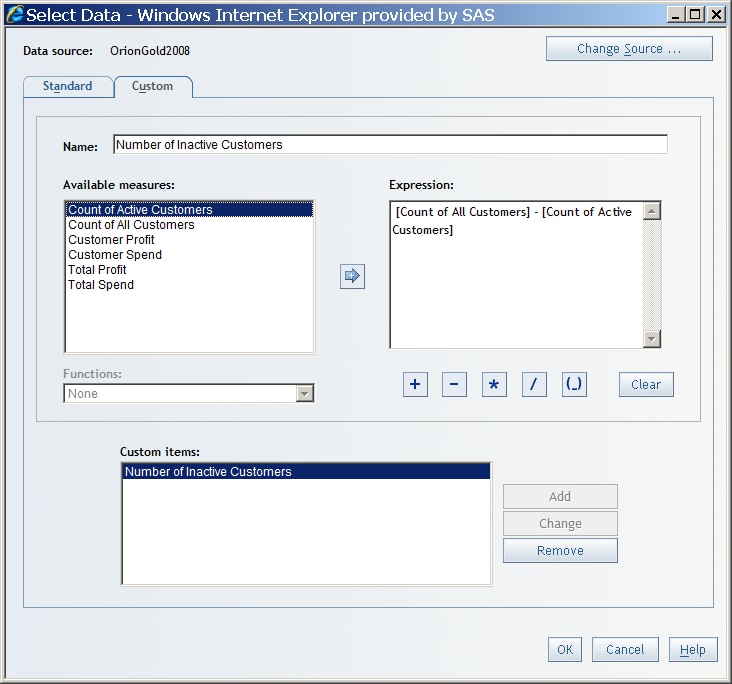
Custom Data Item in the Select Data Dialog Box
-
Click Add to add your custom data item to the Custom items box.
-
Click OK.The custom data item that you created is listed in the Section Data panel with any other selected or created data items.
Modify a Manually Entered Expression
Note: You cannot modify an expression
that uses a relative time function. However, you can click Clear to
clear it from the Expression field.
To modify a custom
data item, complete these steps:
-
In the Section Data panel, select Options
 Select Data to open the Select
Data dialog box.
-
Select the Custom tab.
-
Select a custom data item in the Custom items box.
-
Click Clear and then retype the expression. Then click Change.
-
Click OK.
Remove a Custom Data Item
To remove a custom
data item from a report section, complete these steps:
-
In the Section Data panel, select Options
 Select Data to open the Select
Data dialog box.
-
Select the Custom tab.
-
Select a custom data item in the Custom items box, and then click Remove.Note: If you remove a custom data item, it is no longer available to use in the report. If you change your mind, you must re-create the custom data item. For a list of consequences associated with removing data items, see Remove Standard Data Items.
-
Click OK.
Copyright © SAS Institute Inc. All Rights Reserved.