Managing Conditional Highlighting for Table Values
Add Conditional Highlighting to Table Values
Some conditional highlighting rules have priority over other rules. The conditional
highlighting rules that you define for measures have the highest priority, regardless
of where those measures appear in the table. Conditional highlighting rules that you
define using a category on a row have a higher priority than a rule for a category
on a column. In a crosstabulation table, the conditional highlighting rules that you define using category
A will have a higher priority than those that
you define using category B,
if category A is inside category
B.
The styles that you
specify for colors and fonts are not merged among conditional highlighting
rules. However, if you add highlighting using an image or text, then
those conditions are merged if they are not specified in a conditional
highlighting rule with a higher priority.
To specify conditional
highlighting for values in a table, complete these steps:
-
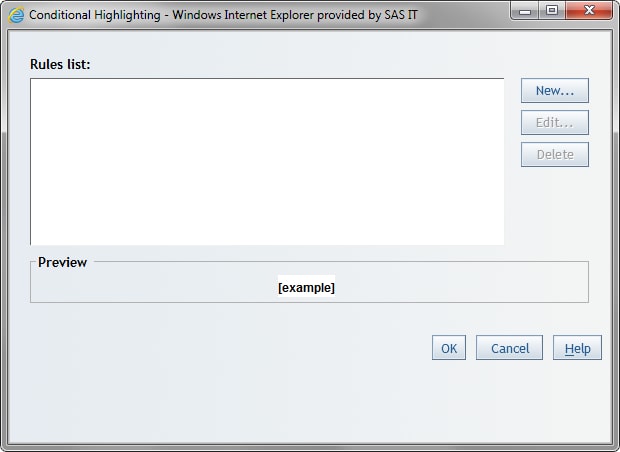
Right-click in the table, and then select Conditional Highlighting to open the Conditional Highlighting dialog box.Note: Hidden data items are not displayed in the Conditional Highlighting dialog box.Conditional Highlighting Dialog Box
-
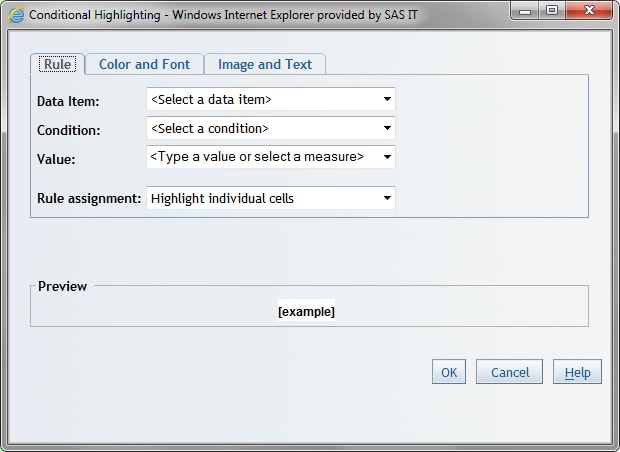
Click New.Three tabs appear in the Conditional Highlighting dialog box: Rule, Color and Font, and Image and Text.Rule Tab in the Conditional Highlighting Dialog Box for a List Table Using Relational Data
-
On the Rule tab, complete these steps:
-
Select an alphanumeric category or a measure in the Data Item field.
-
Select the Condition that you want the selected data item to match.Note: When a category data item is selected, the available conditions are Is equal to and Is not equal to.
-
In the Value field, type in a value or select a measure in the drop-down list. When you click Select for a table that uses multidimensional data, you can select the specific values that the rule applies to.If you selected Is between as the condition, then type a Min value and a Max value. If you selected Is missing value as the condition, then this field is unavailable.Note: If you are creating a condition for percentages, you must enter the conditional value as a decimal number. For example, if you want to filter for values above 50%, enter
.5as the conditional value. -
For list tables, the Rule assignment option lets you specify either Highlight individual cells or Highlight entire row.For multidimensional tables, the Rule assignment option lets you specify which hierarchy level the rule will be applied to.Rule Tab in the Conditional Highlighting Dialog Box for a Table Using Multidimensional Data
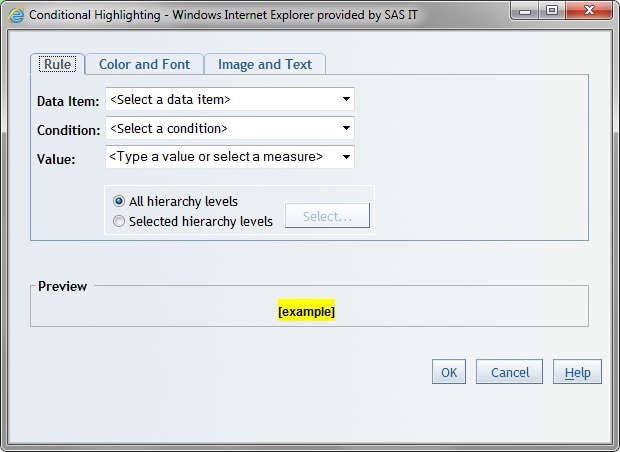 You can specify one of the following:
-
All hierarchy levels, which applies the rule to all hierarchy levels.
-
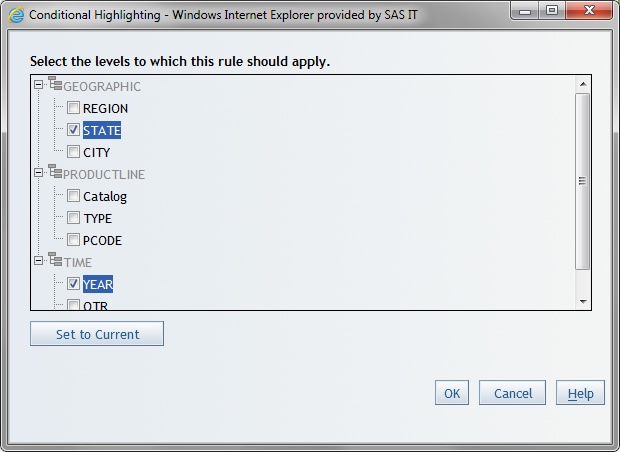
Selected hierarchy levels, which applies the rule only to the hierarchy levels that you specify. Click Select. Select the specific hierarchy levels for the rule. Click OK.Selected Hierarchy Levels in the Conditional Highlighting Dialog Box
-
-
-
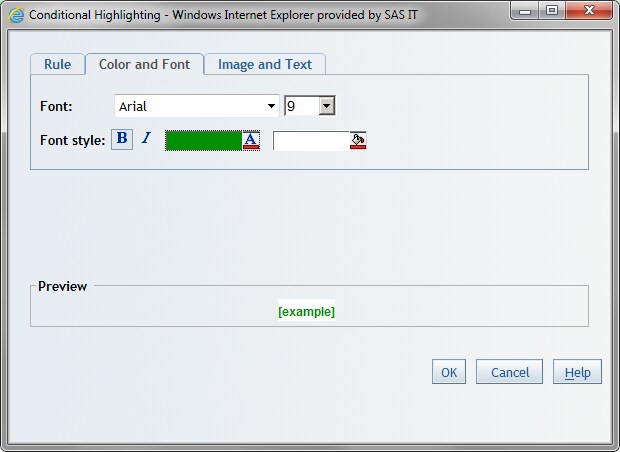
(Optional) On the Color and Font tab, complete these steps to change the default settings:
-
Select the Font, including the font size and font color, that you want to use to highlight values that meet the specified condition. By default, the values that meet the conditional highlighting rule appear in bold.
-
Select the Font style that you want to use to highlight values that meet the specified condition.Color and Font Tab in the Conditional Highlighting Dialog Box for Tables
-
-
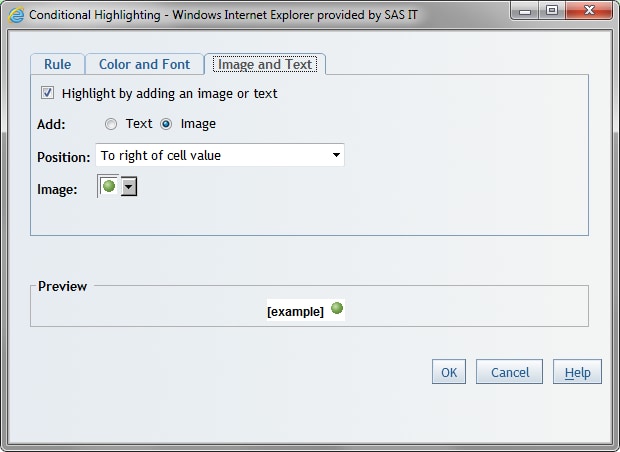
(Optional) On the Image and Text tab, complete these steps:
-
Select the Highlight by adding an image or text option.
-
Indicate whether you want to add an Image or Text when the specified conditions are met.
-
Specify a Position for the image or text. Indicate whether you want the image or text to appear to the right or left of each cell that contains a value that meets the condition or in place of the value.
-
If you are using an image, select the Image that you want to use to highlight values that meet the specified condition.Image and Text Tab in the Conditional Highlighting Dialog Box for Tables with an Image Selected
-
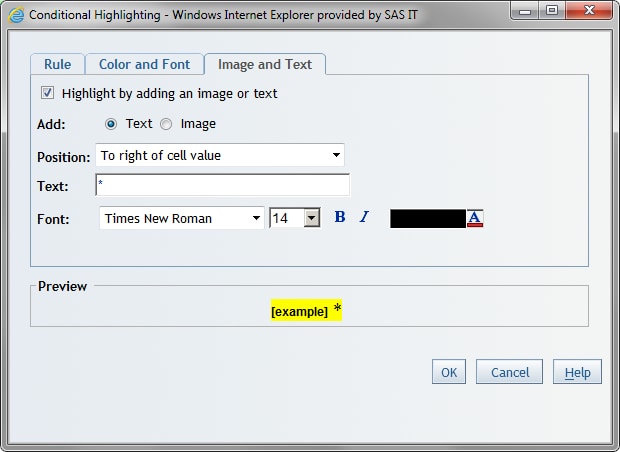
If you are using text to highlight values, type the text into the Text field. Then select the Font and Font style information.In the following display, an asterisk (*) is used as the text.Image and Text Tab in the Conditional Highlighting Dialog Box for Tables with Text Specified
-
-
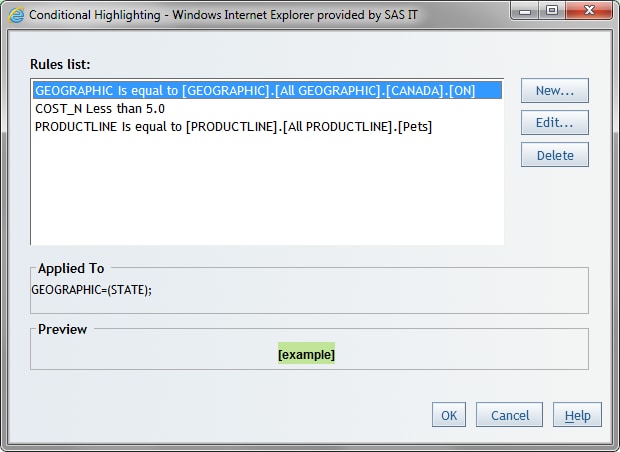
To finish creating or editing the conditional highlighting rule, click OK. The Rules list appears in the Conditional Highlighting dialog box.Conditional Highlighting Dialog Box with Multiple Rules Displayed
-
To close the Conditional Highlighting dialog box, click OK.
Remove Conditional Highlighting from Table Values
To remove conditional
highlighting from table values, complete these steps:
-
Right-click in the table, and then select Conditional Highlighting to open the Conditional Highlighting dialog box.
-
In the Rules list, select a rule.
-
Click Delete.
-
In the confirmation message box that appears, click OK to delete the rule.
-
Click OK.
Copyright © SAS Institute Inc. All Rights Reserved.