Using a Quick Start Method to Create a Report
About the Quick Start Methods
There are five quick
start methods for creating a new saved report. Advantages and Considerations for Each Quick Start Method provides an overview of the advantages and considerations
for each quick start method.
Tip
When reviewing the considerations,
keep in mind that you can use Edit mode to make modifications until
the report is exactly the way that you want it.
Advantages and Considerations for Each Quick Start Method
|
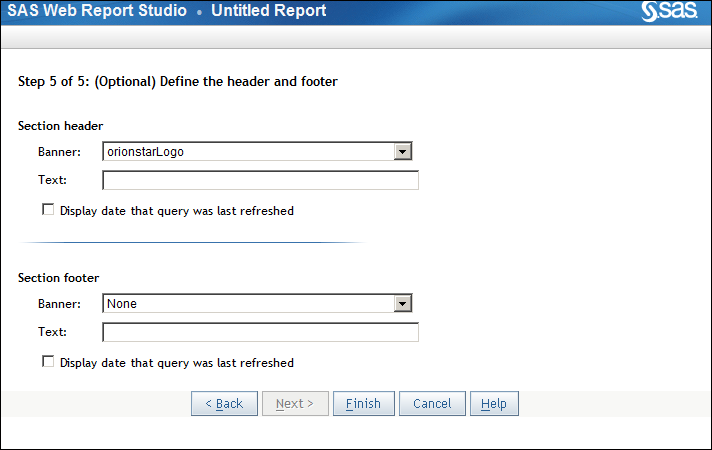
The five-step Report
Wizard guides you in defining a query; selecting a table and graph
for the layout; and adding optional features such as group breaks,
section filters, a header, and a footer. You can also select the format
for displaying the data (for example, the number of decimal places
that are used when displaying a number). When you click Finish,
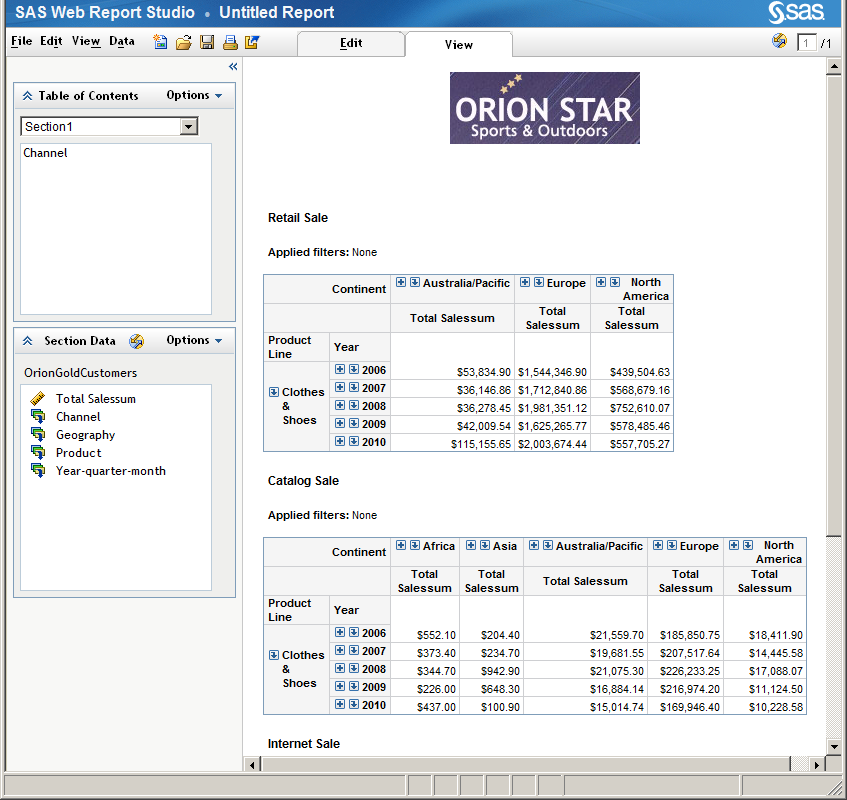
you have a complete, one-section report. Because the resulting report
is based on a data source, you have full access to all the report
objects (tables, graphs, geographical maps, group breaks, headers,
footers, images, and text).
|
||
|
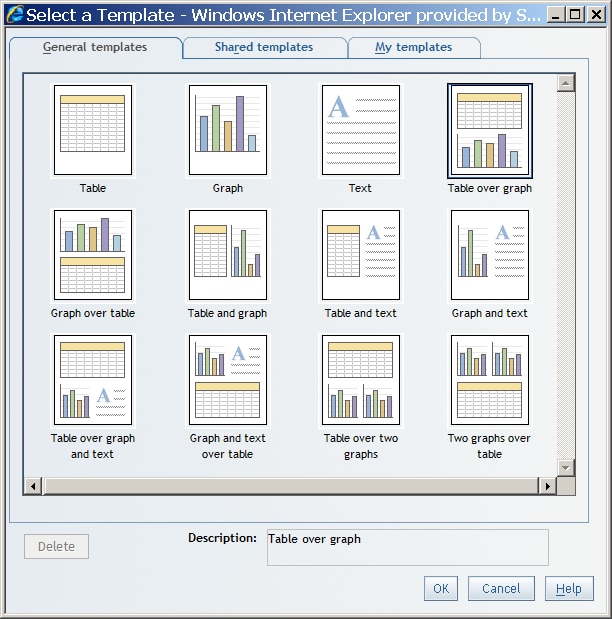
When you select a template,
you start creating your report with an already completed layout design.
The layout can include tables, graphs, images, text, and their last
saved properties; links from images1 and text to Web sites and reports;
a header and a footer; and positioning information. It can also include
stored process objects (without the stored process selected).
|
||
|
When you save a report
based on a data source, you create a new report simply by selecting
an information map, a table, or a cube. Because the resulting report
is based on a data source, you have full access to all the report
objects (tables, graphs, geographical maps, group breaks, headers,
footers, images, and text).
|
||
| 1Images can include links from group break values to prompts in a target report. However, prompt associations cannot be saved in a template because templates cannot contain group break information. | ||
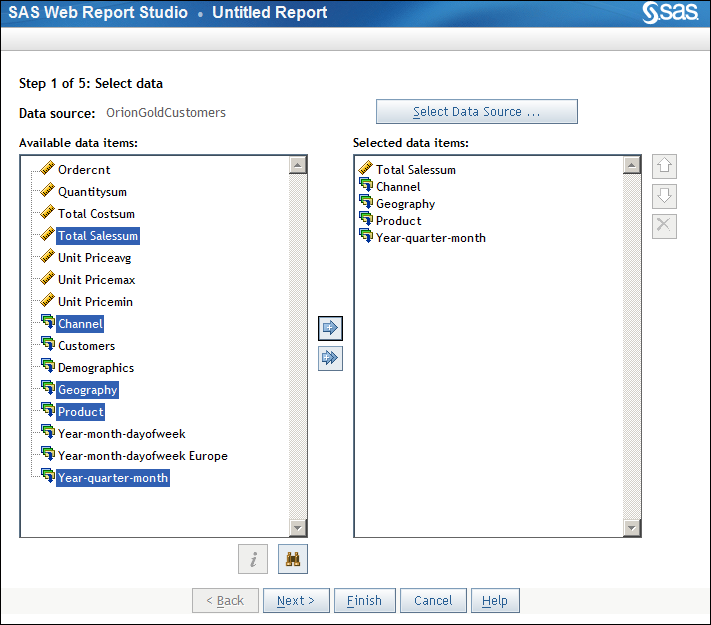
Use the Report Wizard
The Report Wizard guides
you through five steps to create a one-section report that uses standard
data items. To use the Report Wizard, complete these steps:
-
TipAt this point, instead of clicking Next, you can click Finish to display the Edit tab. Defaults are used for any remaining unspecified required content. For example, if you are using a relational data source, a list table is automatically included. For more information about how to save the report at this point, see Save a Report.
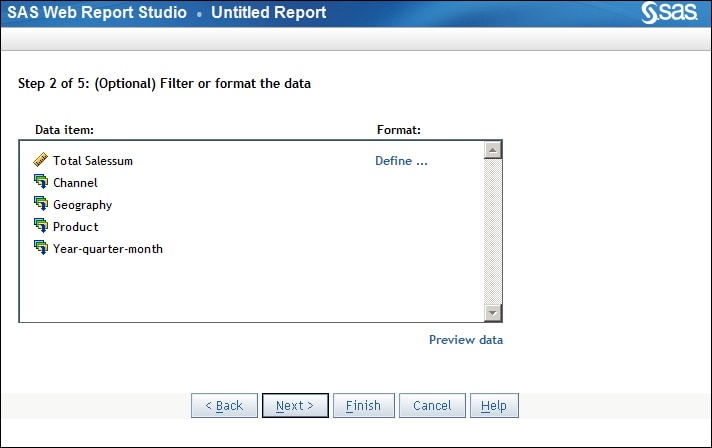
-
(Optional) Select or create a category filter. For more information, see Subsetting Query Results.
-
(Optional) Change the format of some data items. For more information, see Modify the Format of a Standard Data Item.
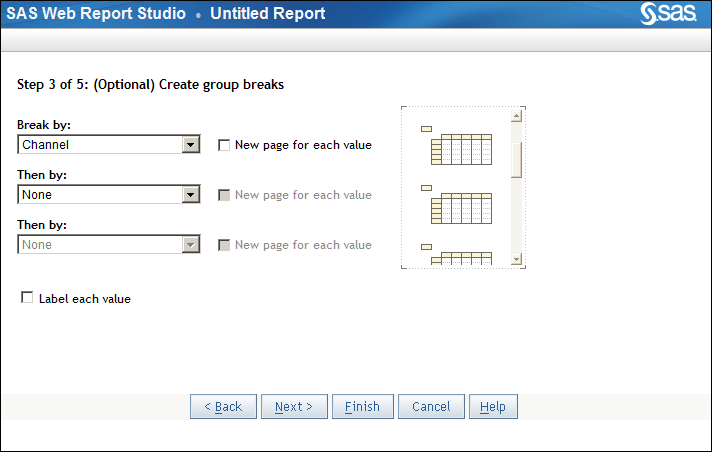
-
(Optional) Create group breaks. A group break is a way to divide report sections by distinct category or hierarchy level values when you are using a relational or multidimensional data source. For more information about group breaks, see Overview of Using Group Breaks.
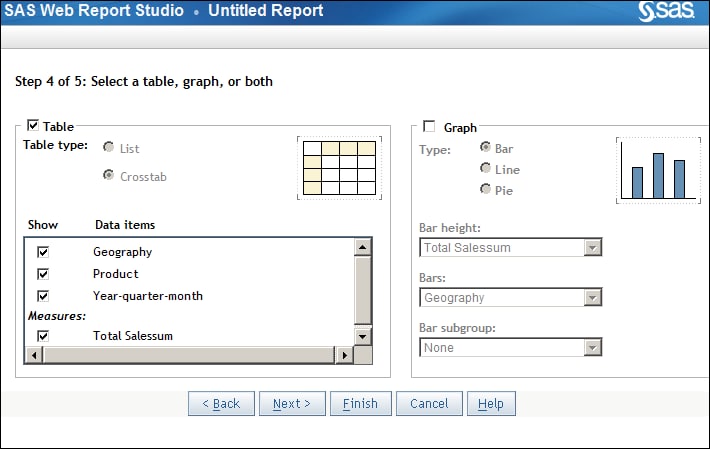
-
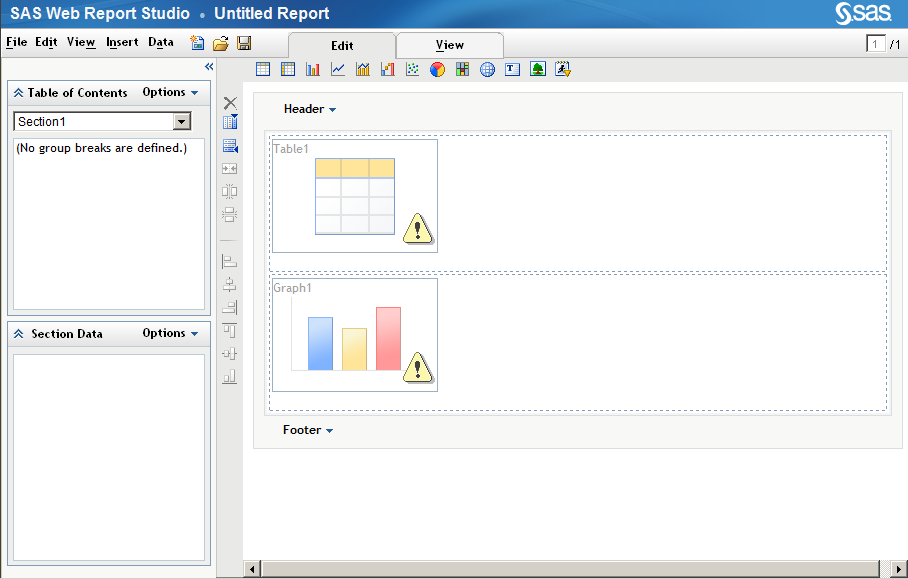
Add at least one view element to display the results of the query, either a table or a graph (a bar chart, a line graph, or a pie chart). The data items that you selected in step 1 are shown as selected to display. Either accept the default data item assignments or deselect the Show check box to hide the data items that you do not want to display.
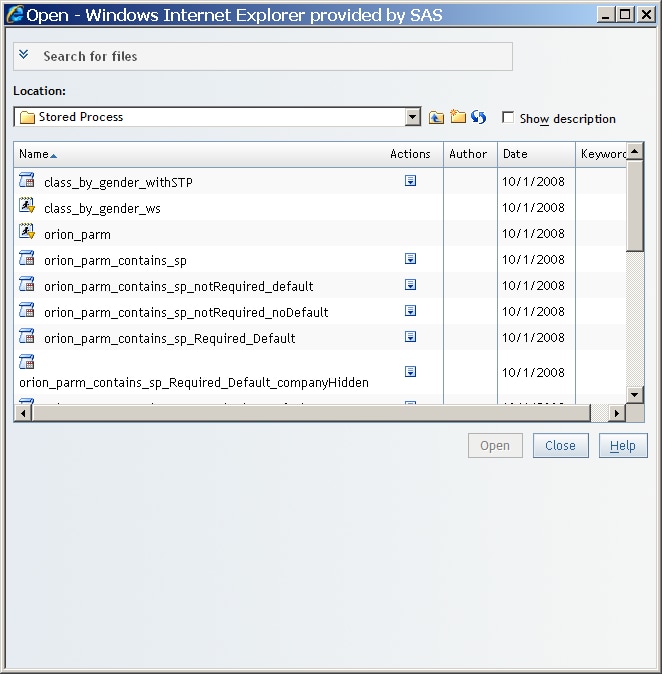
Base a New Report on a Stored Process Report
To save a new report
from a stored process report, complete these steps:
-
Run a stored process by selecting one of the last six viewed stored processes from the File menu or the Welcome window, using the Open dialog box (shown) or using the File Management window.Note: For more information about the File menu and the File Management window, see The SAS Web Report Studio Interface.
Note: By completing the Save
As dialog box, you create a new saved report, either
with the same name as the stored process or with a new name. The original
stored process continues to exist in addition to the new saved report.
For more information
about saved reports that use stored processes, see Including Stored Process Output.
Base a New Report on a Report Template and Then Add Data
Report templates can
contain more than just report objects placed in certain positions.
Properties and, in some cases, linking can also be part of a template.
In addition, templates can contain multiple report sections, each
with a unique layout design.
To create a saved report
by using a template, complete these steps:
-
Define the query by selecting data items from a data source. For more information, see Defining Queries to Obtain Results.
-
Select File
 Save. For more information
about how to complete the Save As dialog
box, see Save a Report.
Save. For more information
about how to complete the Save As dialog
box, see Save a Report.
Base a New Report on Opening a Data Source Directly
A new report can be
based on opening a data source directly. The report uses either a
crosstabulation or a list table to present the results. For more information about which tables are created for
a data source, see Opening Data Sources Directly.
To create a report
by opening a data source directly, complete these steps:
-
Select FileSave. For more information
about how to complete the Save As dialog
box, see Save a Report.
You can use Edit mode
to update a saved report based on opening a data source directly.
To create a saved report from ad hoc output from an information map,
table, or cube and then make changes, complete these steps:

Base a New Report on an Existing Report
If there is an existing
saved report that closely matches the report that you want to create,
you can save the existing report under a new name, which is the only
step that is required to create a new saved report. However, you might
want to use Edit mode to make some customizations. To base a new report
on an existing report, complete these steps:
-
Select FileSave As and complete the Save As dialog
box, giving the report a new name. For more information,
see Save a Report.