Exporting Reports and Report Data
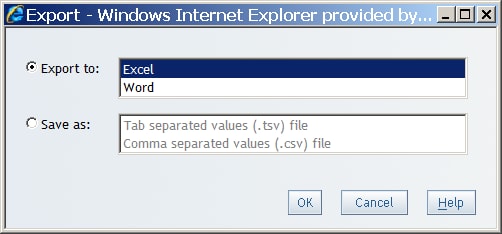
Export the Contents of an Entire Report
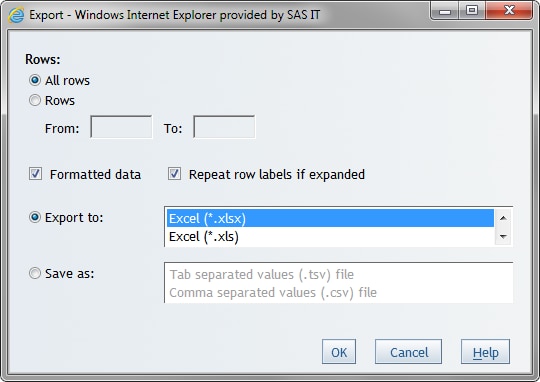
To export the entire
contents of a viewed report, complete these steps:
-
For advanced layout options when exporting entire reports (for example, selecting which tables and graphs to display), use SAS Add-In for Microsoft Office. For more information, see the online Help for SAS Add-In for Microsoft Office. If you do not have SAS Add-In for Microsoft Office, contact your on-site SAS support personnel.

Export Data from a Geographical Map

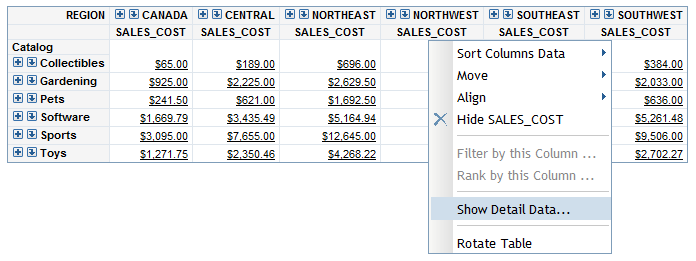
Export Detail Data from a Crosstabulation Table
Note: If you want to see the detail
data before you export it, then see View Detail Data in a Crosstabulation Table.
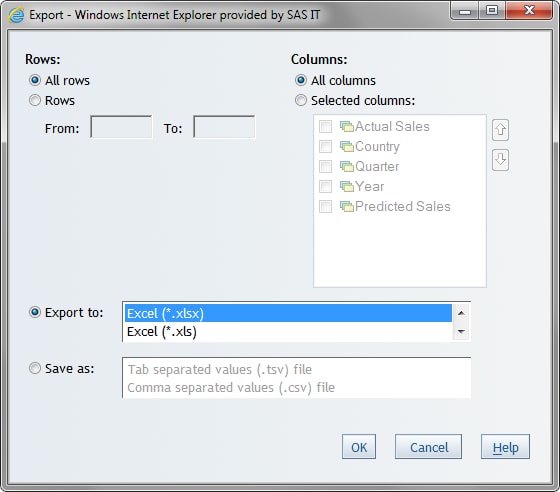
To export detail data
from a crosstabulation table, complete these steps in View mode:
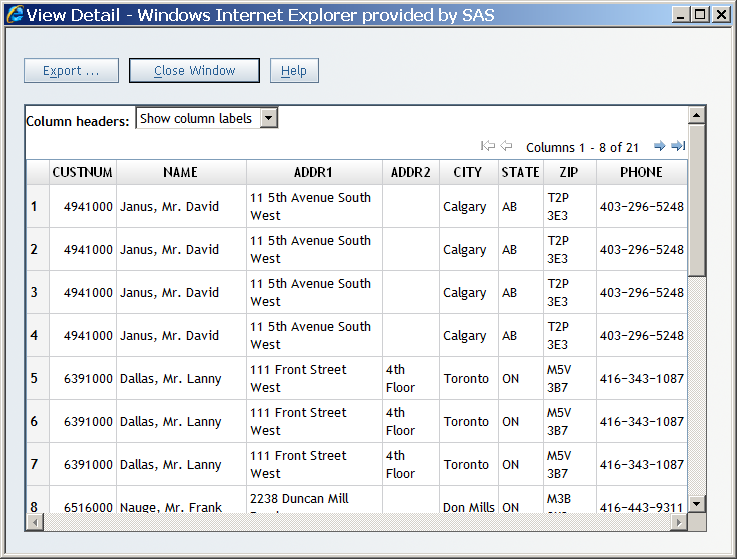
View Detail Data in a Crosstabulation Table
Note: You cannot view detail data
in a crosstabulation table if the data source has not been set up
to support this feature by your data source administrator. In addition,
whether the columns show the column label or the column name is controlled
by a system administrator.
To view detail data
in a crosstabulation table before you export it, complete these steps: