Managing Conditional Highlighting for Graph Values
Add Conditional Highlighting to Graph Values
-
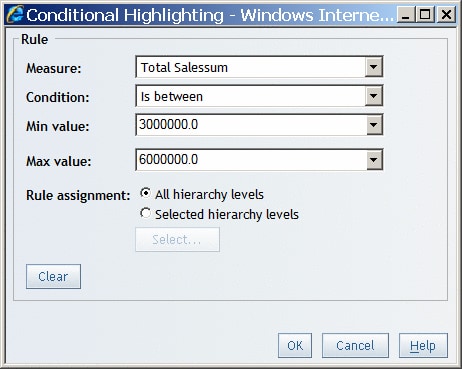
In the Value field, type in a value or select a measure in the drop-down list. If you selected Is between as the condition, then type a Min value and a Max value. If you selected Is missing value as the condition, then this field is unavailable.Note: If you are creating a condition for percentages, you must enter the conditional value as a decimal number. For example, if you want to filter for values above 50%, enter
.5as the conditional value.Conditional Highlighting for Values Between a Minimum and a Maximum Value is an example of the Conditional Highlighting dialog box that was used to create Shoes with Revenues That Are Between Three and Six Million Dollars Are Highlighted .