Using Geographical Maps to Display Query Results

About Geographical Maps

A geographic information system (GIS) is a tool for organizing and analyzing data that can be referenced spatially (that is, data that can be tied to physical locations). Many types of data have a spatial aspect, including demographics, marketing surveys, and customer addresses. A GIS helps users analyze data in the context of location.
For example, if report viewers need to evaluate population data for census tracts, a report author could render the information in a table. However, it would be easier and more effective for viewers to see the information in the context of the geography of the tracts. When evaluating information that has a spatial component, viewers might find it easier to recognize relationships and trends in the data if they see the information in a spatial context.
You can insert geographical maps only if the report query uses data items from a multidimensional data source that is enabled for geographic mapping.
A Geographical Map Based on a Geographic Hierarchy That Contains U.S. Census Data

Insert a Geographical Map

If the current report section uses data items from a multidimensional data source that is enabled for geographic mapping and that contains a geographic hierarchy, then you can insert a geographical map into the layout.
To insert a geographical map into the layout of a report section, perform one of these tasks:
  • Click geographical map icon on the layout grid toolbar to insert the geographical map in the next available cell.
  • Drag the geographical map tool from the toolbar into a specific cell.
Note: For more information about how to position objects in the layout grid, see Overview of Positioning Report Objects.
You can also perform one or more of these tasks:
Note: These tasks can also be performed in View mode.

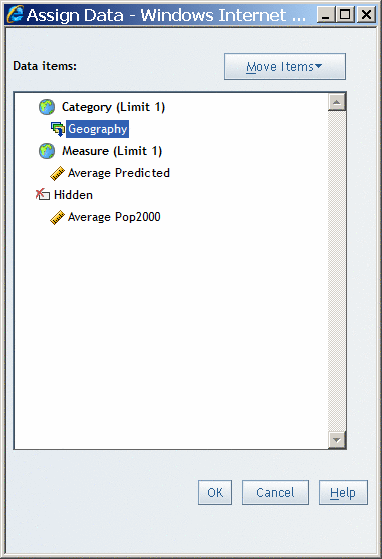
Select a Measure for a Geographical Map

By default, the first measure selected from the data source is used for the geographical map. To specify a different measure (if one is available), complete these steps:
Note: You can also complete this task in View mode by selecting a measure from the drop-down list in the geographical map legend.
  1. In Edit mode, select Datathen selectAssign Data or right-click in the geographical map, and then select Assign Data to open the Assign Data dialog box.
  2. Perform one of these tasks to assign data items:
    • Use drag and drop features to assign data items.
    • Use the Move Items drop-down list to assign data items.
    You can assign a data item to one of these functions:
    Category (Limit 1)
    Select a category or hierarchy. Category is required.
    Measure (Limit 1)
    Select a measure. Measure is required.
    Hidden
    Data items that are assigned to Hidden do not appear in the geographic map but can be used in filtering.
    For more information, see Hiding Data Items.
    Assign Data Dialog Box for Geographical Maps
    Assign Data Dialog Box for Geographical Maps
  3. Click OK.

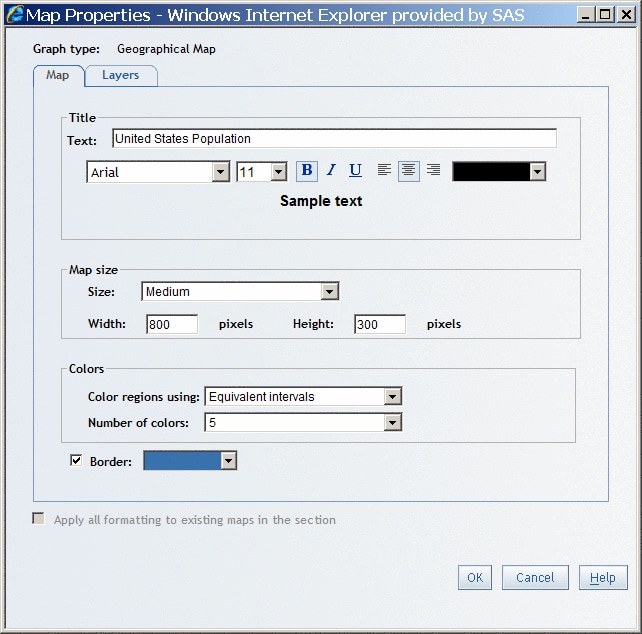
Change the Measure Used in a Geographical Map

A report section can contain a geographical map if the section query uses data items from a data source that is enabled for geographic mapping. The geographical map is rendered by using two data items from the data source: one measure and the geographic hierarchy.
To change the measure that is used in a geographical map (if there are other measures available), select the new measure in the drop-down list that is located in the geographical map's legend.
A Geographical Map with Average Predicted Population Selected as the Measure

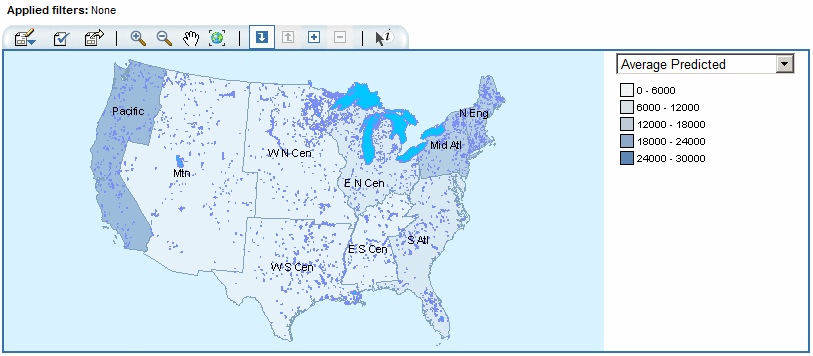
Zoom and Pan a Geographical Map

To focus on a specific geographical map area or zoom in or out on a selected region, click the buttons on the geographical map toolbar, as shown in Zoom and Pan Buttons for Geographical Maps.
Zoom and Pan Buttons for Geographical Maps
Button
Action
Zoom in icon
Zooms in on a selected area. Click and drag the mouse to select the area that you want to zoom in on.
zoom out icon
Zooms out from a point. Click a point on the geographical map to zoom out and center on that point.
drag icon
Moves the geographical map content within the viewing area. Click and drag the map until the viewer shows the area that you want to see.
reset icon
Resets the zoom level to undo any zooming or panning that has been done.

Specify Properties for a Geographical Map

To specify properties for a geographical map, complete these steps:
  1. In Edit mode, right-click in the geographical map, and then select Properties or in View mode, click properties icon on the map toolbar to open the Properties dialog box.
    The Map tab is displayed by default.
  2. On the Map tab, accept or modify these properties:
    1. If you want a Title to appear above the geographical map, type the text, and then specify the font, font size, font style, alignment, and color. You cannot use these characters: < > & #
    2. From the Size drop-down list, choose Custom, Small, Medium, or Large. If you select Custom, type the Width and Height pixel values.
      Tip
      You can also resize the geographical map by using your mouse. Point to the bottom right corner or to the bottom or right border. When the pointer becomes a diagonal or horizontal bar, drag the geographical map to the new size and then release the mouse button.
    3. Choose one of the following methods to color the regions of the geographical map:
      Equivalent intervals
      Each color in the geographical map is defined by the range of the data divided by the number of colors.
      Natural breaks
      Each color in the geographical map is defined by natural breaks (or interruptions) in the data. The breaks are based on a histogram of data distributions.
      Quantiles
      The measure values are sorted and an equal number (data points) are assigned to each color according to their sorted value.
      Standard deviations
      The mean and the standard deviation values for the measure are calculated. The number of regions on the geographical map is determined by adding or subtracting the standard deviation to the mean value.
    4. Select the Number of colors to use for the coloration method that you chose. The default is 5. The maximum is 12. Regardless of your selection, the geographical map legend do not contain more colors than there are members in the currently displayed hierarchy level.
      The colors used depend on the currently applied style sheet.
    5. Select a Border color for the geographical map.
    The Map Tab in the Map Properties Dialog Box
    The Map Tab in the Map Properties Dialog Box
  3. On the Layers tab, select the layers that you want to include in the geographical map. The Layers tab lists which, if any, information layers have been created by your data administrator. Examples include Major roads, Schools, Lakes and reservoirs, and Elevation.
  4. Click OK.