Using Tables to Display Query Results
Overview of the Table Types
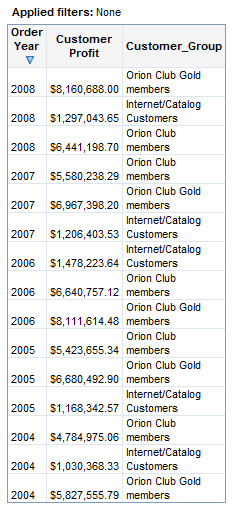
About List Tables
A list
table is a two-dimensional representation of data, in which the data
values are arranged in unlabeled rows and labeled columns. List tables
are applicable when you use data items selected from a relational
data source.
For more information,
see Using Tables to Display Query Results.
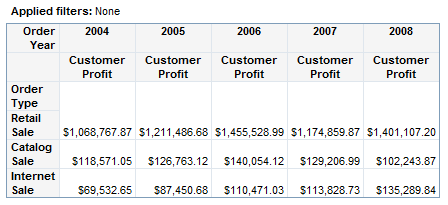
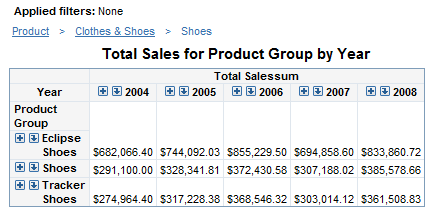
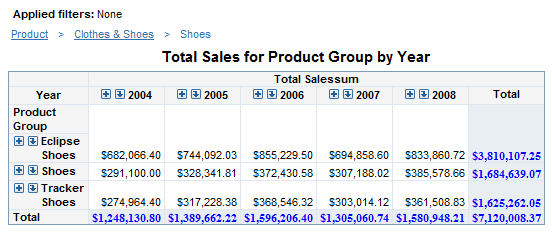
About Crosstabulation Tables
A crosstabulation
table shows frequency distributions or other aggregate statistics
for the intersections of two or more categories. In a crosstabulation
table, categories are displayed on both the columns and the rows,
and each cell value represents the data result from the intersection
of the categories on the specific row and column.
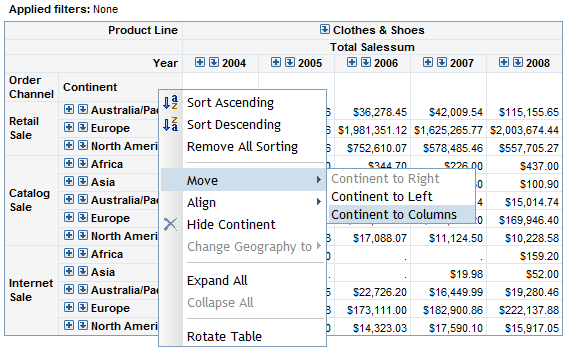
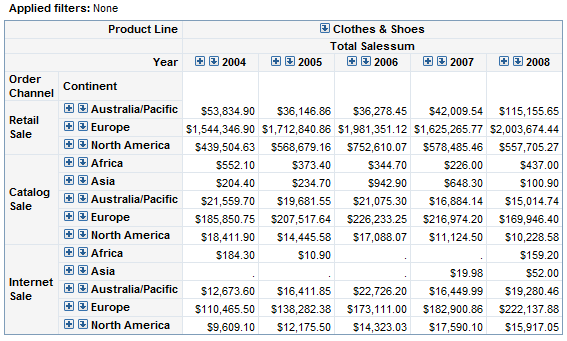
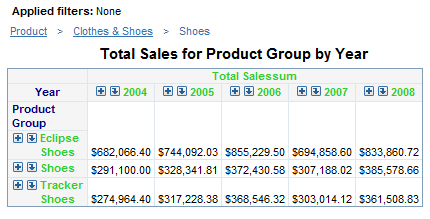
In This Crosstabulation Table That Is Based on Data Items From
a Multidimensional Data Source, Drilling and Expanding Are Enabled
Tip
For crosstabulation
tables that are based on multidimensional data sources, the hierarchy
level names are displayed in the table, rather than the hierarchy
names. In In This Crosstabulation Table That Is Based on Data Items From a Multidimensional Data Source, Drilling and Expanding Are
Enabled, Year is a level in a hierarchy
named Time, and Continent is a level in a hierarchy named Geography.
Insert a Table into a Report Layout
If the
section query is based on a relational data source, you can display
the query results in a list table or a crosstabulation table. If the
section query is based on a multidimensional data source, you can
display results in a crosstabulation table.
For more
information, see Specifying How Data Items Are Used in Tables.
Tables
also have default properties that you can change. For example, by
default, tables do not have titles. To create a title, you open the Properties dialog box and enter text in the Title field on the General tab.
For more information, see Specify Style Properties for Total and Subtotal Values.
Tip
In general,
the defaults for properties that are related to style (for example,
font and color) depend on the currently applied report style. For more information,
see Modifying Report Properties.Specifying How Data Items Are Used in Tables
Assign Data Items to Functions in List Tables
-
Data items that are assigned to Hidden do not appear in the table but can be used in filtering. For more information, see Hiding Data Items.
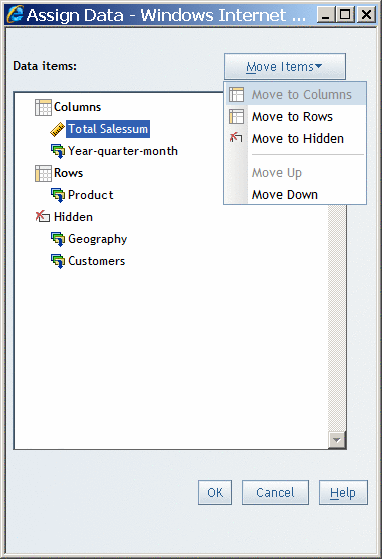
Assign Data Items to Functions in Crosstabulation Tables
-
Data items that are assigned to Hidden do not appear in the table but can be used in filtering. For more information, see Hiding Data Items.
Create or Modify a Table Title
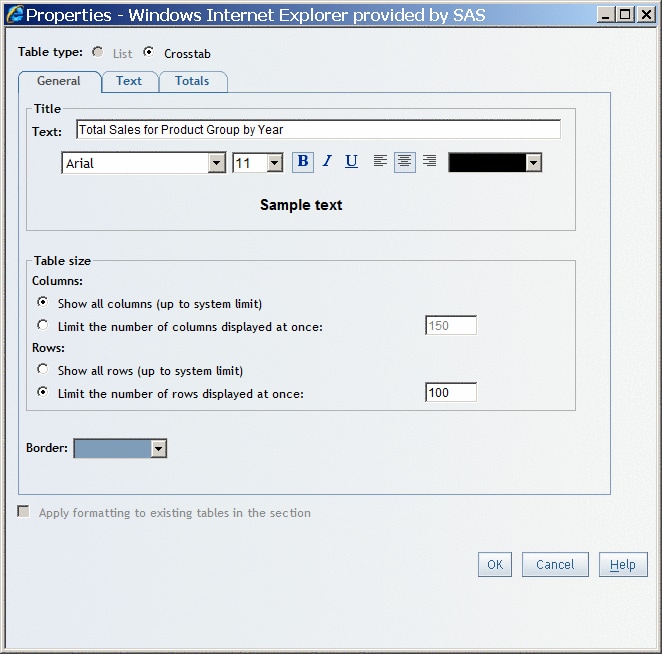
Specify the Number of Columns and Rows to Display in a Table

Specify the Border Color of a Table
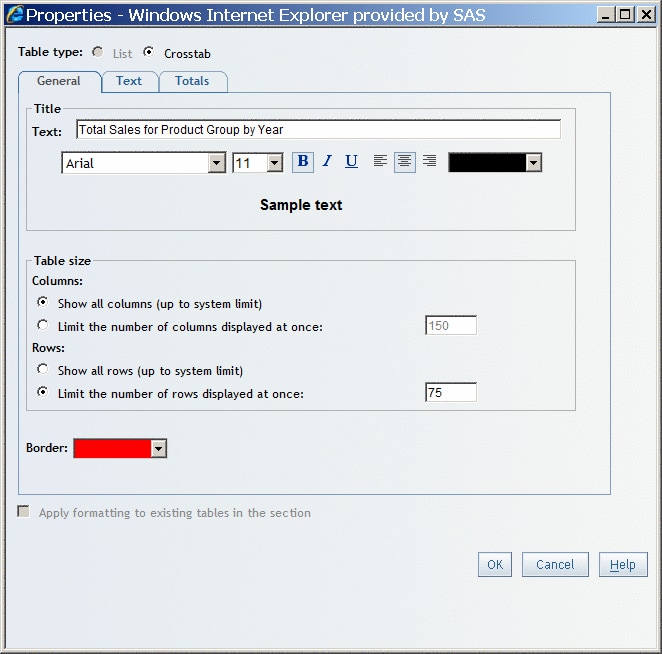
In New Border Color Specified in the Properties Dialog Box, red was selected as the new border color. In View mode,
all of the borders for this table change to red.
Specify Style Properties for Headings, Subheadings, and Cells
To specify
style properties such as font, alignment, and color for headings,
subheadings, and cells, complete these steps:
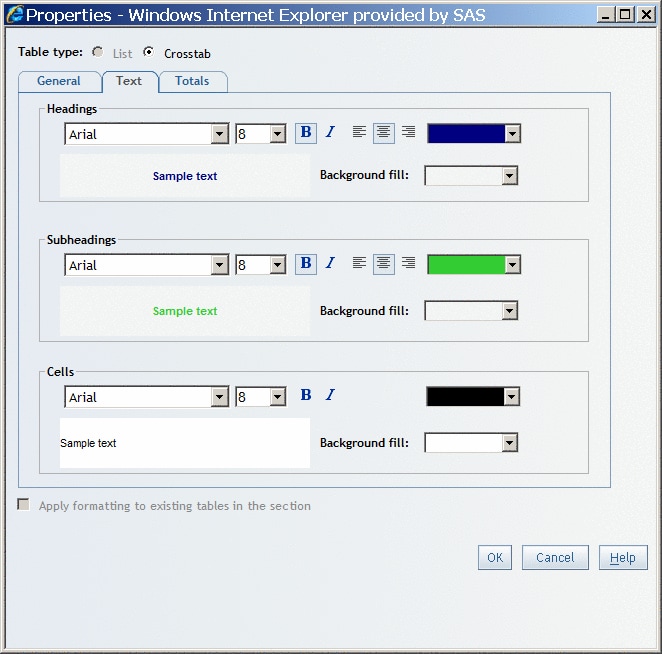
In New Headings and Subheading Colors Specified in the Properties Dialog Box, navy blue was selected as the new heading color and green
was selected as the new subheading color. In View mode, the headings
and subheadings change to the new colors.
Specify Style Properties for Total and Subtotal Values
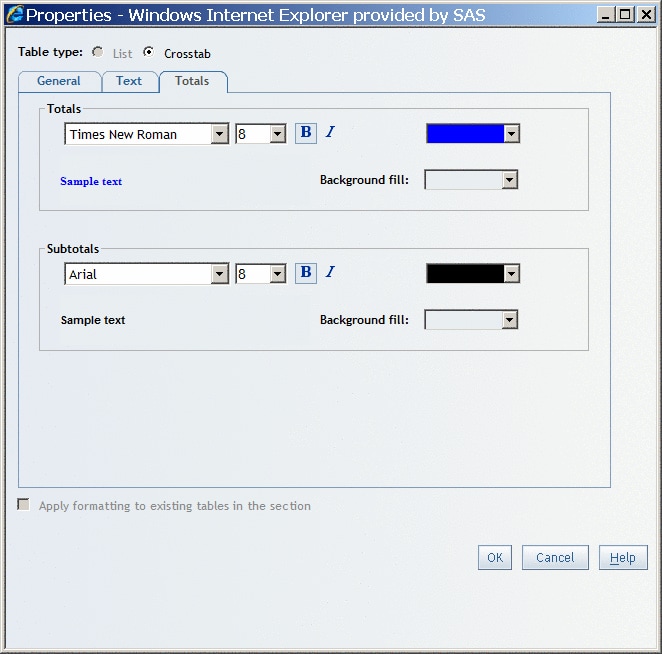
Note: You can choose
to show or hide totals in a table. For more information,
see Show or Hide Totals and Subtotals for Crosstabulation Tables.
Copy the Formatting of a Selected Table
Change the Currently Selected Table Type
The data
item assignments and properties are changed to match the new table
type. For example, not all data items are supported in crosstabulation
tables that are based on relational data. So, if you change a list
table to a crosstabulation table, then any measures that use the distinct
aggregation type are removed. That is, they do not appear in the Assign Data dialog box.