Customizing Report Styles for SAS Web Report Studio
Overview of Providing Custom Report Styles
Report viewers can select one of the
following styles (which ship with SAS Web Report Studio) for a report:
Plateau, Meadow, Seaside, or Festival. The default report style is
Plateau. You can add your own custom styles to the list of available
styles.
Note: The ability to apply custom
styles is available for applications that run in all locales worldwide.
SAS Web Report Studio relies
on CSS files to render styles for reports. To supply a custom style,
follow these steps:
-
Create a CSS file and define the formats that you want for the style.SeeCSS Formats for Custom Report Styles .
-
In the Web Report Studio 4.3 Properties dialog box within SAS Management Console Configuration Manager, provide information that SAS Web Report Studio needs in order to locate and render the style. See Specify Property Names and Values for Styles.
Specify Property Names and Values for Styles
The following table shows the
property names that you specify, and explains the property values
that you enter in the Advanced tab of the
Web Report Studio 4.3 Properties dialog box.
Property Names of Report Styles Specified in the Web Report
Studio 4.3 Properties Dialog Box
CSS Formats for Custom Report Styles
About Cascading Style Sheet Formats
In order to provide
custom report styles, you create one or more CSS files. CSS files
are text files that can be edited with a text editor. CSS file enables
specified formats (CSS rule sets) to be available for users to modify
in SAS Web Report Studio. These files are stored in the
C:\SAS\config\Lev1\Web\Applications\SASWebReportStudio4.3\customer folder.
A default CSS file is also available at that location.
When CSS files are created
and their filenames are specified on the Advanced Tab of
the Web Report Studio 4.3 Properties, the
following elements can be modified by users in SAS Web Report Studio:
In the CSS file, lines
that start with < or - are considered comments. These lines are
ignored by SAS Web Report Studio.
A sample CSS file is
available to help you develop your own custom styles. The file
Seaside_CSS.css was
copied to the customer folder when
you installed and then configured SAS Web Report Studio. This CSS
is based on the built-in Seaside style.
For instructions about
making the CSS formats available to SAS Web Report Studio, see Specify Property Names and Values for Styles. For information about CSS files in general, see the W3C
organization's Web site at http://www.w3.org/TR/CSS21.
Supported Properties
This table lists the properties that
are supported for the property types that are explained through examples
later in this chapter.
Supported Properties for CSS Formats
|
marker-symbol1
|
|
| 1Possible values are: TRIANGLEFILLED, SQUAREFILLED, STARFILLED, HEXAGONFILLED, CIRCLEFILLED, CROSSFILLED, FLAGFILLED, CYLINDERFILLED, PRISMFILLED, X, SPADEFILLED, DIAMONDFILLED, HEARTFILLED, CLUBFILLED, POINT, NONE. | |
Tables
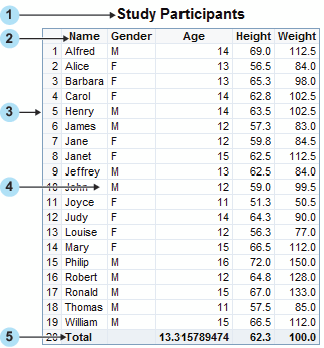
CSS Formats for List Tables
|
Text1, cell, border
|
||
| 1The alignment (text-align property) for cells is overridden based on data type (numeric versus text). | ||
Note: In the CSS file, you must
define the Table format before you define any of its descendant formats,
such as Table Caption or Table Column Label.
For more information
about the supported property types, see Supported Properties for CSS Formats.
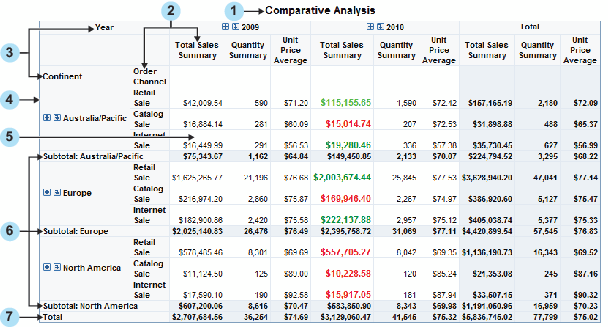
CSS Formats for Crosstabulation Tables
|
Text1
|
||
| 1The alignment (text-align property) for cells is overridden based on data type (numeric versus text). | ||
Note: In the CSS file, you must
define the Table format before you define any of its descendant formats,
such as Table Caption or Table Column Label.
For more information
about the supported property types, see Supported Properties.
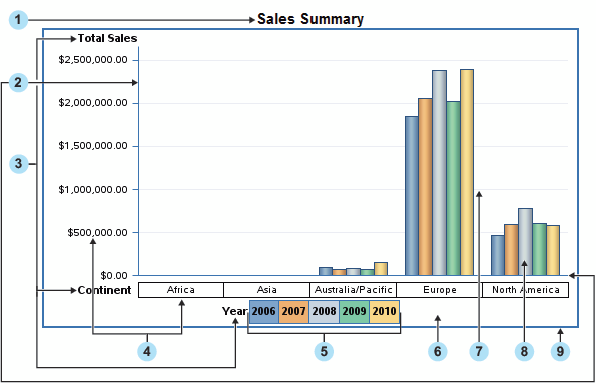
Graphs
Like tables, graphs support styles for
different aspects of their rendering. However, when subgroups are
used in a graph, you should specify a unique format for each subgroup
value in order to distinguish between the values. Subgrouping is
data-dependent (for example, one subgroup might have three values,
whereas the same subgroup on different data might have nine values).
Therefore, SAS Web Report Studio supports a flexible collection of
rules called graph data styles. A report scheme can consist of up
to 12 specified graph data styles. Each graph data style can in turn
be used for a particular subgroup of data.
Graph GraphDataStyle1
{
        color : red;
        marker-symbol : DIAMONDFILLED;
        marker-size : 10px;
        line-thickness : 2px;
}
Graph GraphDataStyle2
{
color : green;
marker-symbol : CIRCLEFILLED;
marker-size : 10px;
line-thickness : 2px;
}Graph GraphDataStyle3
{
color : blue;
marker-symbol : SQUAREFILLED;
marker-size : 10px;
line-thickness : 2px;
}This method enables
you to define graph schemes that supply common formats across different
types of graphs. Not all the graph data styles are used for each graph.
Note: The progressive bar chart
and the geographical map do not support the GraphDataStylen formats.
The supported formats for these charts are described later in this
section.
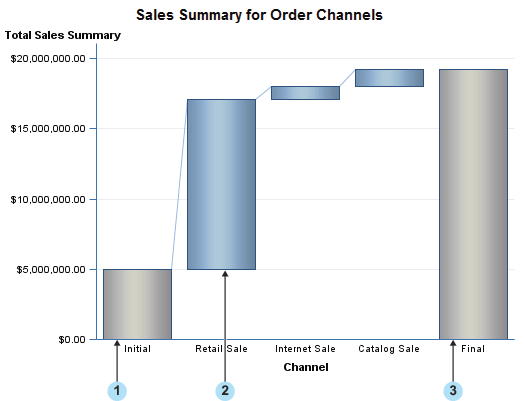
The following figure
shows a sample bar chart, followed by a list of the supported formats
for elements in the graph.
For more information
about the supported property types, see Supported Properties for CSS Formats.
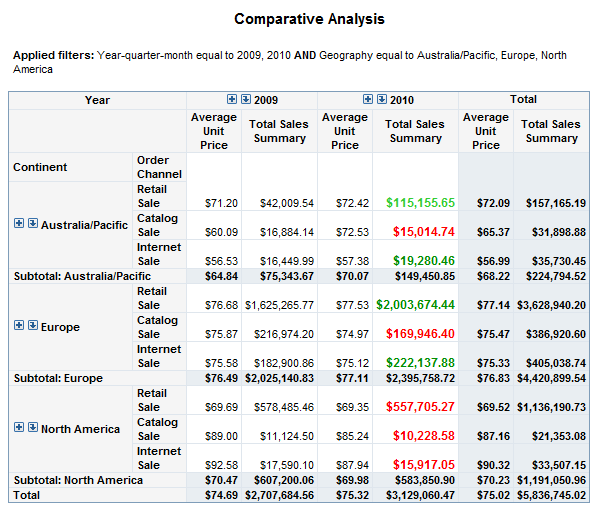
Display Filters
Display filters for
graphs, tables, and synchronized objects must be specified individually.
The following figure shows display filters for a table.