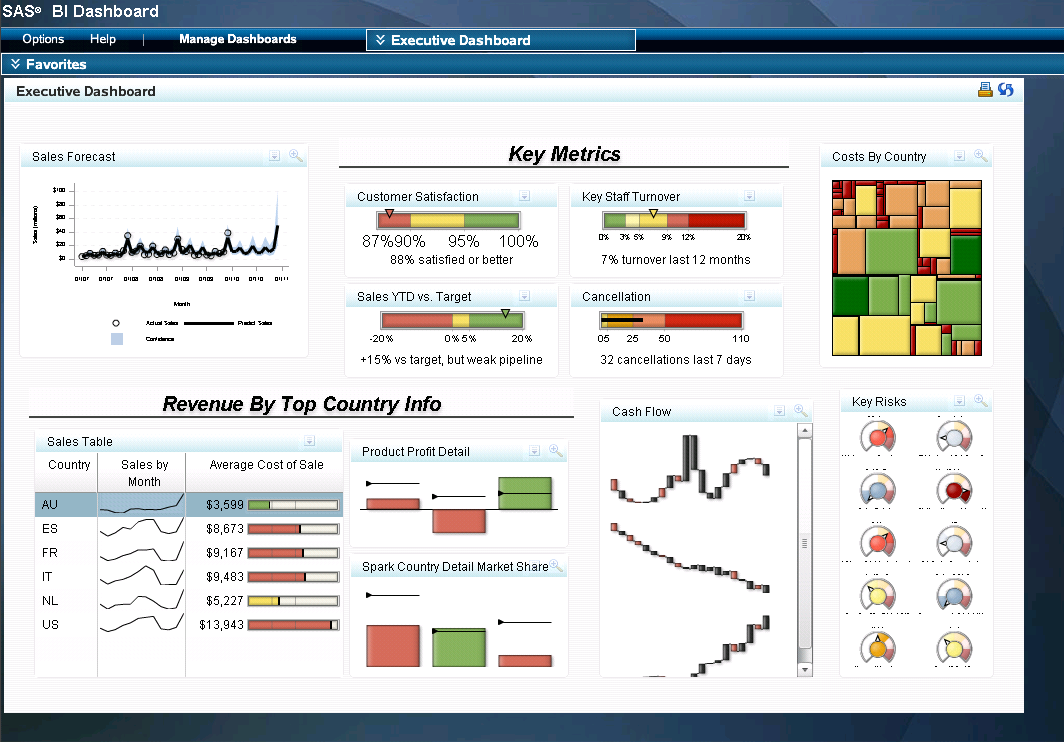
SAS BI Dashboard
Overview
SAS BI Dashboard 4.31 enables users to create, maintain,
and view dashboards to monitor key performance indicators that convey
how well an organization is performing. SAS BI Dashboard 4.31 includes
an easy-to-use, drag and drop interface for creating dashboards that
include graphics, text, colors, and hyperlinks. The application leverages
Adobe Flash Player (Version 10.0 or later) in the Rich Internet Application
(RIA) architecture.
With the ability to
save favorite indicators and add comments, users can collaborate and
easily access dashboards with customized information. All content
is displayed in a role-based, secure, customizable, and extensible
environment. For more information about SAS BI Dashboard 4.31, see
the SAS BI Dashboard: User's Guide.
SAS BI Dashboard 4.31
uses the remote portlet architecture of SAS Information Delivery Portal.
Dashboards can be displayed as SAS portlets in the SAS Information
Delivery Portal or a JSR 168 compliant portal server such as the WebSphere
Portal. For more information about SAS BI Portlets, see Using the SAS BI Portlets from a Portal. For more information about remote portlets, see Developing
Portlets for the SAS Information Delivery Portal.
Using SAS BI Dashboard Portlet with WebSphere Portal
The SAS BI Dashboard
4.3 portlet is installed along with other SAS BI Portlets. This portlet
is compatible with JSR 168. Use of this portlet with the WebSphere
Portal requires the completion of additional configuration and deployment
steps before it can be accessed within the WebSphere Portal. SAS Information
Delivery Portal must be installed and configured to enable the use
of SAS BI Portlets from the WebSphere Portal. For more information,
see SAS BI Portlets for WebSphere 7.
Location of Dashboards and Indicators after an Upgrade
If you upgraded to the 4.3
or 4.31 version of SAS BI Dashboard from the 3.1 or 4.2 versions of
SAS BI Dashboard, dashboards and objects in the dashboard (such as
indicators, models, and ranges) are saved in SAS Folders as metadata
objects. Therefore, any dashboards that you created before SAS BI
Dashboard 4.3 are saved as metadata objects. The default location
for these metadata objects is the
Products\BIDashboard
                     4.3
directory. This directory contains the DashboardConfigs,
DashboardDisplayConfigs, Indicator Definitions, Model Configs, and
RangeDefinitions subdirectories.
