Custom Graph
Definition
A custom graph is a
graph that exists as an image. The information in that image does
not have to be a graph, but can be anything represented by an image.
For a sample of the indicator data that was used to create this indicator, see “Sample Data Structure” for this indicator.
Usage Information
You can use this indicator in the following ways:
For
an example of using this indicator, see
Example: Creating a Custom Graph That Uses a Stored Process.
-
by specifying indicator data. When you make this specification, additional settings become available that enable you to select a simple gauge that is displayed with your image. This single gauge reads only the first row of data in the selected indicator data. The gauge applies the range intervals of the specified range to that row of data.Note: The gauge might not have any relationship to the image that you specify, and specifying an image is optional.
-
without specifying indicator data. You can specify an image for the indicator to display, but there is not an accompanying gauge.
|
Data best suited for
|
The custom graph indicator is a combination of a gauge and an external image that is used by reference in SAS BI Dashboard.
You reference the image
by specifying a Web address. Custom graphs can be used for a variety of purposes, but are especially useful when a picture
is needed to illustrate a result or status. For example, if a company sells a wide variety of similar products, you can display
an image of a product next to its sales data.
You can also use a stored process with a custom graph indicator to produce a graphical display that is not possible with the SAS BI Dashboard itself. To use
a stored process, you must create
a stored process that is appropriate for inclusion in a dashboard and then derive the Web address that renders the stored
process output. For more information about using stored processes, see
Sample Data Structure.
|
|
Not suited for
|
Do not use this indicator to display static images. Instead, use the static image component provided by SAS BI Dashboard.
For information about
static content, see
Linking to Other Information by Adding Static Content.
|
|
Target audience
|
Some audiences might not be familiar with gauges. However, gauges are not difficult to interpret, so even if a user is unfamiliar
with this indicator type, they should be able to understand it. Adding a custom image provides context for the user that might
improve understanding.
Audiences that might be familiar with this indicator type include business analysts, business users, executives, and financial
analysts.
|
|
Data aggregation support
|
This indicator type does not aggregate the indicator data.
|
|
Range support
|
Ranges are optionally supported.
Note: A range is required if you
also select indicator data to use with the custom graph indicator.
|
|
Alert support
|
Alerts are supported only if a range is associated with the indicator. For information, see
Customizing Alerts.
|
|
Link support
|
This indicator type can be used to define a link or as the destination of a link. For
more information about defining an indicator with a hyperlink, see
Adding Links to Indicators or Other Content.
|
|
Interaction support
|
|
|
Filter multiple items
support
|
Filtering multiple items is not supported.
|
General Settings
The General Settings
section provides controls that support the following tasks:
If you click  to select the custom graph indicator type and you have specified indicator data, the Gauge and Range lists appears. From these lists, you can select a gauge subtype and range to use. See
Gauge Subtypes for the available
subtypes.
to select the custom graph indicator type and you have specified indicator data, the Gauge and Range lists appears. From these lists, you can select a gauge subtype and range to use. See
Gauge Subtypes for the available
subtypes.
to select the custom graph indicator type and you have specified indicator data, the Gauge and Range lists appears. From these lists, you can select a gauge subtype and range to use. See
Gauge Subtypes for the available
subtypes.Display Settings
The following display settings are used in the preceding
figure. For more information, see “Sample Data Structure”
for this indicator.
|
Display Setting
|
Selection Used for Figure
|
|---|---|
|
KPI title
|
Set to (none).
|
|
Image Web address
|
http://sasbi.demo.sas.com:8080/SASStoredProcess/do?_action=form, properties,execute,nobanner,newwindow&program=%2FOrion+ Star%2FSales+Department%2FStored+Processes%2FUSGeoSales_Map |
You can customize the following display settings for this indicator:
-
From the Range value list, select the value to which you want to apply the defined range intervals.Note: If you do not specify indicator data and a range, this setting is not available.
-
From the KPI title list, select the value to use as the title for the gauge.Note: If you do not specify indicator data and a range, this setting is ignored.
-
In the Image Web address field, type the Web address to use for an image or other information in the indicator. The following image file types are supported: JPG, PNG, and GIF (but not animated GIF). For more information, see Sample Data Structure.Note: This field does not support relative pathnames. If you import or export the custom graph indicator as part of a package, you must update the path in this field.
-
When you specify an image in the Web address, you have the choice of using a proxy. Click Use proxy to specify that a server proxy is used in the indicator.If you use a proxyThe image file must be in the same network domain as the SAS BI Dashboard server.Note: You can enable Adobe Flash to load images from other domains by creating a cross-domain policy file in the root of the Web server. For more information, search the Adobe Web site for
cross-domain policy file specification.If you do not use a proxyThe image file must be accessible to the SAS middle tier. Ensure that the SAS middle tier has the correct user credentials to access the Web address.Note: When using a stored process, select Use proxy so that the proxy server detects from the Web address that the target is a stored process request. The proxy server then adds authentication for the current user to the SAS middle tier.
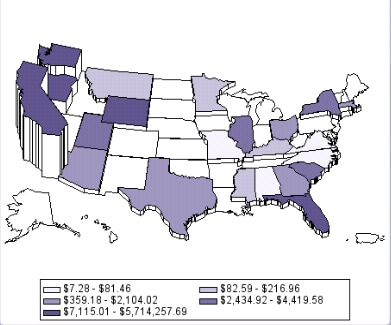
Sample Data Structure
If you opt to use this indicator with indicator data and a range, the resulting gauge reads only the first row of data provided
by the indicator data.
The custom graph indicator type displays an image. The image can be the output of a stored process or other software. For more information about using a stored process, see
Example: Creating a Custom Graph That Uses a Stored Process.
Use the following guidelines
when using a stored process:
-
The output type for the stored process must be set to streaming.
-
To determine the Web address for a stored process, use the Stored Process Web application. Open the Properties window and highlight the Web address. Then, press CTRL + C to copy the Web address.TipWhile highlighting, you might have to drag the mouse downwards to force the page to scroll and reveal the entire Web address.
-
HTML output is not supported. The stored process output must create only an image that is streamed back to the indicator.
-
Do not use the %STPBEGIN and %STPEND macros.
-
The stored process must write to the reserved fileref _WEBOUT.
-
When using a stored process, select Use proxy so that the proxy server detects from the Web address that the target is a stored process request. The proxy server then adds authentication for the current user to the SAS middle tier.
Copyright © SAS Institute Inc. All rights reserved.