Setting Personal Indicator Alerts
Overview
A personal
indicator alert is an alert that is sent only to you.
This is different from an indicator alert,
which is sent to a list of one or more alert subscribers. Indicator
alerts are defined and attached to an indicator by a dashboard designer.
A personal alert is in addition to
any indicator alerts.
Understanding Alerts
The Alert Definition
How Alerts Are Triggered
An alert is triggered
in the following way:
-
SAS BI Dashboard periodically checks for a change in the indicator data, updates to the indicator alert definition, or both. By default, this check happens every 3 minutes. A SAS BI Dashboard administrator can change this setting.
-
If an update is detected and the percentage of data points in the trigger interval has changed, the alert criteria are evaluated.
-
If the criteria are met, an alert is triggered and a notification is sent to the subscriber.
Alert Criteria and Data Aggregation
If an indicator can
aggregate data, it is important to understand that the percentage
that is used by alerting is calculated by evaluating the underlying
indicator data to determine the number of data points in the interval.
The software does not evaluate
the aggregated results presented in the graph view. For example, if
a bar chart has three bars, each bar can represent an average of multiple
data points. A given bar might fall within the alert interval. However,
it is possible that none of the individual data points associated
with that bar fall in the same interval. In this case, the three bars
reflect the aggregated data, not the data points used in the alert
calculation.
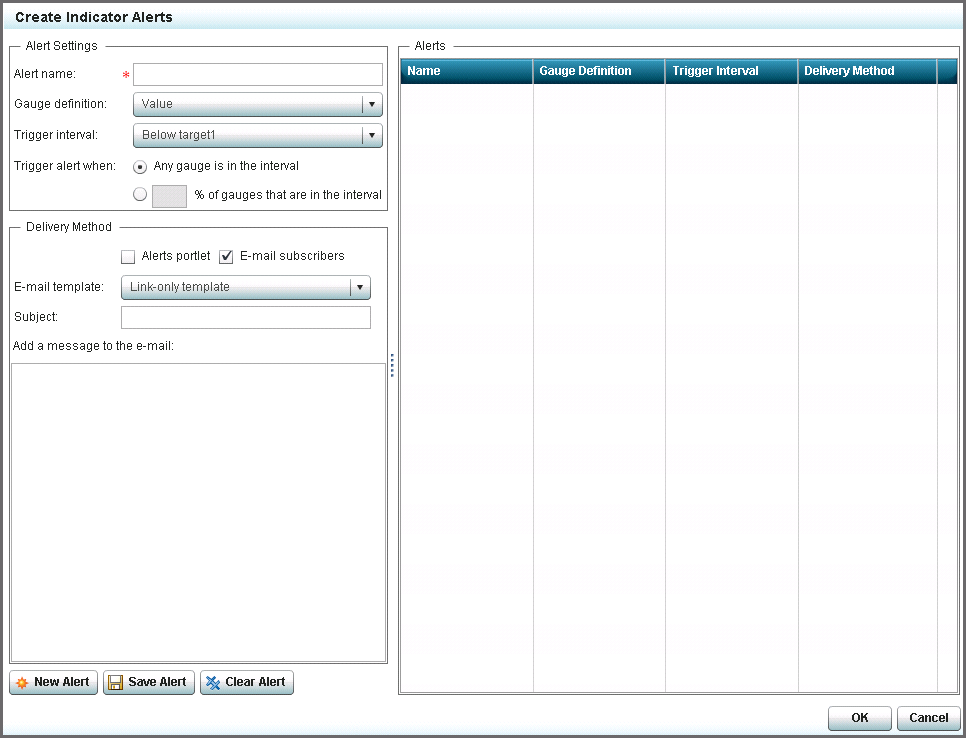
Create an Alert
To create a personal
indicator alert, complete the following steps:
-
In the indicator title bar, click
 and then click Personalize Alerts. The Create
Indicator Alerts window appears.
Note:Contact the dashboard designer for assistance.
and then click Personalize Alerts. The Create
Indicator Alerts window appears.
Note:Contact the dashboard designer for assistance.-
Alerts can be used only with indicators that use a range. For information, see Indicator Types That Support Ranges.