To create an indicator,
complete the following steps in the SAS BI Dashboard designer:
-
In the workspace, click

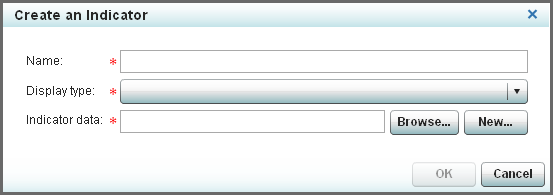
. The
Create an Indicator window
appears.
-
In the
Name field,
type the name.
-
From the
Display
type list, select the indicator type to use.
Note:
-
-
-
Depending on your selection, additional
controls might appear in the
Create an Indicator window.
-
If you selected KPI,
select the type of gauge to use in the KPI from the
Gauge
type list.
-
Specify the indicator
data to use.
Note: Some indicator types do not
require indicator data.
|
|
Next to the Indicator
data field, click Browse, navigate
to the indicator data, and then open it.
|
|
|
|
-
If you selected an indicator
type that supports the use of a range, specify the range to use.
|
|
Next to the Range field,
click Browse, navigate to the range file,
and then open it.
|
|
|
Next to the Range field,
click New. For more information,
see Create a Range. |
-
If you selected the
following indicator types, specify the X-axis range and Y-axis range:
-
Interactive summary and scatter
plot
-
-
Click
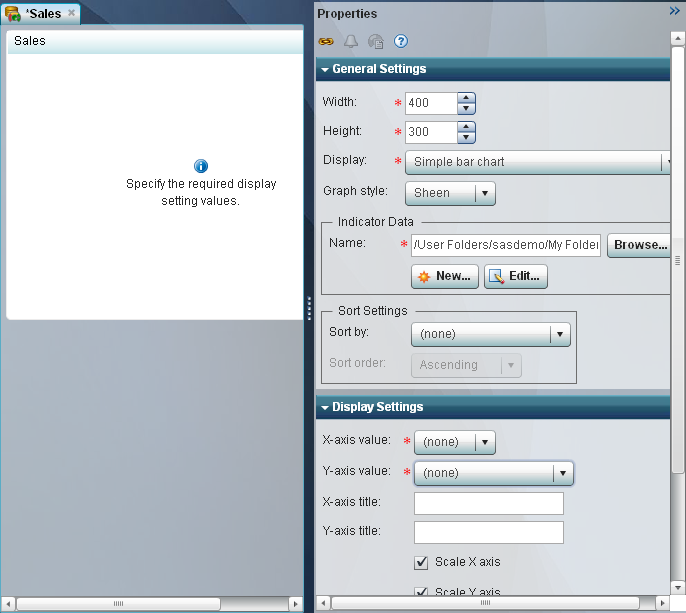
OK.
The indicator tab opens in the workspace. Use the
Properties pane
to specify additional settings and features for the indicator.
For more information,
see Setting Indicator Properties.