If you select
KPI from
the
Display list, complete the following
steps.
-
In the General section of the Properties
pane, from the
Gauge list, select the type
of gauge to use for the indicator.
-
If the
Gauge
style list appears, select a gauge style.
-
If you select a dynamic
gauge, complete the following steps.
Note: Dynamic gauges include the
word “dynamic” in the gauge name.
-
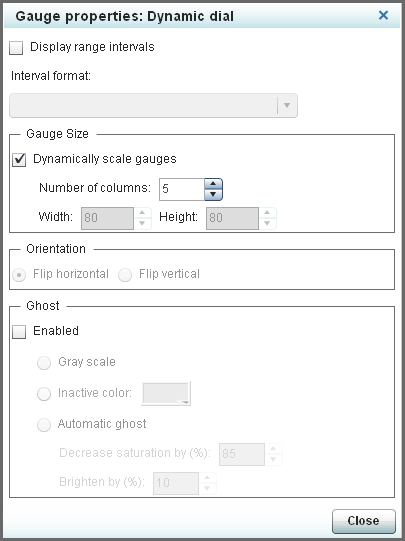
Click

at the top of the Properties pane. The
Gauge
Properties window appears. Available settings varies
depending on the selected style of gauge.
-
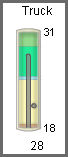
To display range intervals
(tick marks) on the gauge, click
Display range intervals,
and then select the format from the
Interval format list.
With Range Intervals
Displayed
|
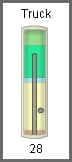
Without Range Intervals
Displayed
|
|
|
|
-
To specify the dimensions of the gauge, perform one of
the following steps in the
Gauge Size area:
-
Click
Dynamically scale
gauges and then specify the number of columns.
-
Clear
Dynamically scale
gauges and then type values for the height and width.
-
Specify
how to orient the gauge by selecting one of the following settings:
-
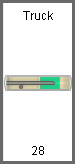
To change the colors
in the gauge to create a ghost effect, click
Enabled and
select one of the following settings in the
Ghost area:
|
|
|
|
|
|
|
The selected interval
is a darker gray than the other intervals.
|
|
|
|
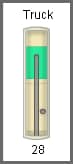
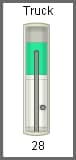
The areas that are not
part of the selected interval are a specific color. To select the
color, click  .
Note: In this example, the Inactive
color setting is set to purple.
|
|
|
|
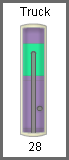
The software determines
how to best create the ghost colors for the intervals.
To limit how far away
from gray or a neutral color of equal intensity the image varies,
type a value in the Decrease saturation by (%) field.
To brighten the image,
type a value in the Brighten by (%) field.
Note: In this example, the Decrease
saturation by (%) setting is set to 60% and the Brighten
by (%) setting is set to 10%.
|
-
When complete, click
Close to
exit the
Gauge Properties window.
-
(Optional) In the
Sort
Settings area, specify how to sort the displayed data
by completing the following steps:
-
From the
Sort
by list, select the data column to use to sort your data.
-
From the
Sort
order list, select ascending or descending order.
-
In the Display Settings
section of the Properties pane, from the
Range value list,
select the value to which you want to apply the defined range intervals.
-
From the
Range
value 2 list, select a second data value point to represent
in the gauge. An example of this second data value point is the dot
in the following gauge:
Note: Not all gauges use this property.
-
From the
KPI
title list, select the title that you want to use for
the gauges displayed in the KPI indicator. For example, if you select
Name,
each gauge is titled with a name from the
Name column
in the data.
-
If the values that you
selected for the KPI title are long, from the
Lines for
title list, select the number of lines that you want
to reserve for displaying the KPI title.
Note: If necessary, word wrapping
occurs in the middle of the string, but only if you select multiple
title lines. If enough lines are not available, the string is truncated
to the width of the gauge.
-