Dashboard Design Ideas
SAS BI Dashboard provides
many new types of indicators as well as new interactive features.
Depending on your design choices, a dashboard can now provide application-like
services to its users. With version 4.3 and later, users not only
view dashboards, but interact with and use information accessed from
dashboards in many ways.
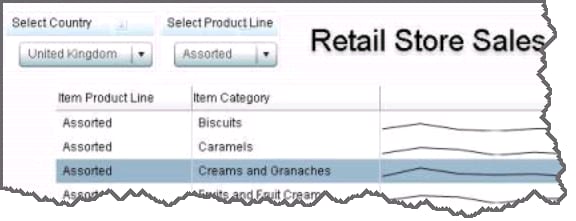
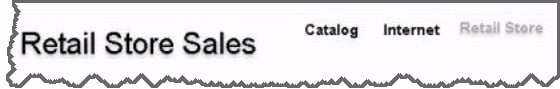
You can build links
to other information in your dashboards. The following design ideas
use links from static labels and images in a dashboard:
For examples showing how to create links, see Linking to Other Information by Adding Static Content.
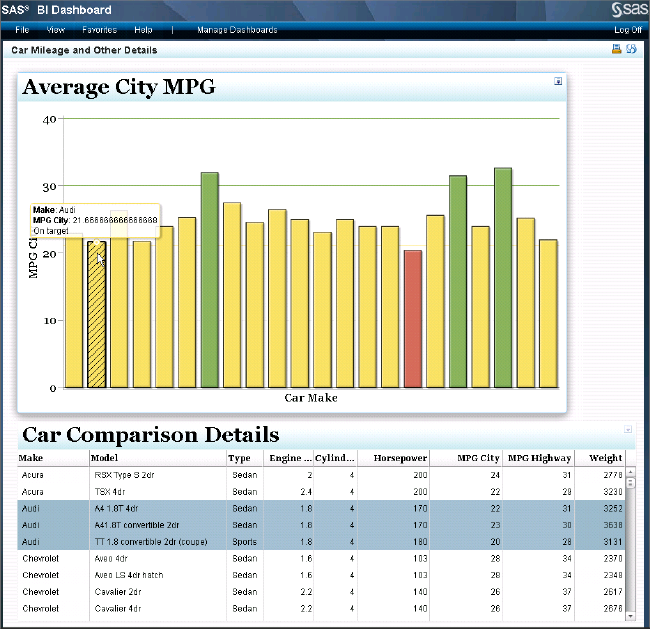
You can also set up
interactions between indicators on a dashboard that help analyze information.
With these features, dashboards are no longer about viewing information,
but about interacting with provided information and data.
For
more information, see Adding Interactions between Indicators.