Data in SAS/GIS Applications
SAS/GIS Data Types
contains the coordinates
and identifying information that describes the map features such as
streets, rivers, and railroads.
Attribute data provides
the information that you want to analyze, and spatial data provides
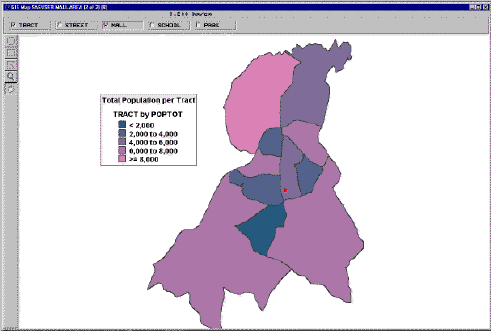
the context in which you want to analyze it. For example, consider
the SAS/GIS map shown in the following display. Spatial data provides
the boundaries for the map areas, and attribute data provides the
population information that is used to color the map areas.
Spatial Data
Overview of Spatial Data
Spatial data contains
the coordinates and identifying information that are necessary to
draw maps. For SAS/GIS software, spatial data is stored in SAS/GIS
spatial databases, which consist of collections of SAS data sets and
SAS catalog entries. The primary method for creating a SAS/GIS spatial
database is through the SAS/GIS Import facility, either in batch or
in interactive mode. You can also use the GIS procedure to create,
modify, and manage the catalog entries in a spatial database.
Spatial Data Layers
Features in the spatial
data are organized into layers. A layer is a collection of all the
features in the map that share some common characteristic. The various
physical aspects of the map—political boundaries, roads, railroads,
waterways, and so on—are assigned to layers according to their
common spatial data values. Some features can appear in multiple layers.
For example, a street can also be a ZIP code boundary and a city boundary
line. The street could appear in three layers: one containing the
streets, one containing the ZIP code boundaries, and one containing
the city boundaries.
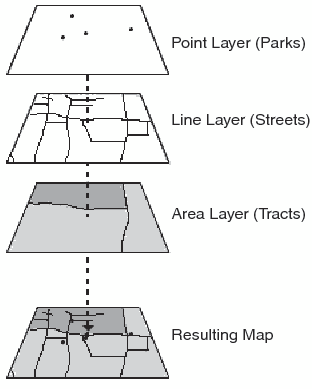
Three types of layers can be represented in SAS/GIS maps:
points, lines, and areas. For example,
When the various layers are overlaid, they form a
map, as shown in the following figure.
A layer can be displayed as either static or thematic.
When a layer is displayed as static, it uses the same graphical characteristics
(color, line, width, and so on) for all features in that layer. For
example, a street layer could use the same color and line style to
display all the streets. When a layer is displayed as thematic, it
uses different graphical characteristics to classify the features
in that layer. For example, a theme representing sales regions could
use different colors to show the quarterly sales performance of each
region. A theme in a layer representing highways could use different
line widths to show the classes of roads. A layer can have multiple
themes stored in it, and you can easily change which theme is currently
displayed.
Spatial Data Coverages
In SAS/GIS software,
maps display only the portion of the spatial data that falls within
a given coverage. A coverage defines a subset of the spatial data
that is available to a map. The coverage can include all the spatial
data in the database, or only selected portions. For example, a spatial
database might contain geographic data for an entire country, but
a coverage might restrict the portion that is available for a given
map to only one region. You can define more than one coverage for
each spatial database, although a map uses only one coverage at a
time.
Spatial Data Composites
Most operations in SAS/GIS
software use composites of spatial data variables rather than the
actual spatial data variables themselves. Composites identify the
relationships and purpose of the variables in the spatial data.
For example, if the
spatial data has the variables STATEL and STATER that contain the
state ID codes for the left and right sides of each feature, then
the spatial database could define a composite named STATE that identifies
the relationship between these variables and specifies that they delineate
state areas in the map. You would use the STATE composite, rather
than the actual STATEL and STATER variables, to link state areas in
the map to attribute data for the corresponding state.
See Spatial Database Details for more information about the structure of SAS/GIS spatial databases.
Attribute Data
The second type of data
that is used in a GIS is attribute data. In SAS/GIS software, your
attribute data must be stored in either a SAS data set or a SAS view.
SAS views enable you to transparently access data in other formats.
For example, you can create a SAS/ACCESS view to access data in a
database such as DB2. A DATA step view or an SQL view also enables
you to access an external file, or any other type of data from which
you can create a SAS view. Once your attribute data is accessible
either as a SAS data set or through a SAS view, it can be linked to
your spatial data for use in labeling, analysis, or theming. For example,
your spatial data might represent a county and contain information
for city boundaries, census tract boundaries, streets, and so on.
An attribute data set with population information for each census
tract can be linked to a map using the corresponding tract composite
in the spatial data.
Some of the ways in
which you can use attribute data in SAS/GIS software include the following:
-
Define actions that display or manipulate the attribute data when features are selected in the map. This way, you can explore your attribute data interactively rather than simply view static results. The actions can range from simple, such as displaying observations from an attribute data set that relate to features in the map, to complex, such as submitting a procedure from
SAS/STAT software to perform a statistical analysis.
Designing a SAS/GIS Spatial Database
SAS/GIS Data Types
One of the first steps
in a SAS/GIS project is determining the design of your SAS/GIS spatial
database. The database will contain the following types of information:
Before you begin creating
the spatial database, you should draw up an overview of the system
goals and data requirements. The time you spend designing your database
initially will save you time and expenses later in the project. A
well-designed database is easier to maintain and document, and you
can extend it for future GIS projects.
Use the following guidelines
when determining the information that you want to include in a database:
Enable Linking between Spatial Features and Attribute Data
To use attribute data
for map actions, themes, or labeling, the attribute data set must
contain the same identification information as the spatial feature
that it describes so that you can link between them. For example,
if your attribute data has Sales Revenue for stores, and Store ID
Numbers, you probably want to include the actual location in longitude
and latitude for each Store ID Number on your spatial data list. You
can then place a marker at the store location and also visualize and
analyze the corresponding attribute data for each store.
Use No More Details than You Need
Use only the data that
you need for your project. For example, if you have store locations
that request the customer ZIP code at the cash register, you should
not assume that you need ZIP code boundaries on your map. ZIP code
boundaries might be far too small for your purposes if you have stores
nationwide. You might decide instead that the three-digit ZIP code
boundaries provide fewer, yet more appropriately sized, areas for
your analysis. You can summarize your attribute data to the three-digit
ZIP code level and use it for your analysis, reducing both the amount
of spatial data and attribute data that you need. As long as it is
appropriate for your analysis, decreasing the amount of required spatial
and attribute data reduces storage space and improves performance.
Reducing the level of detail in the spatial data also saves money
if you have to purchase the data.
Ensure a Common Level of Spatial and Attribute Data
If you plan to summarize
your attribute data to a matching level of your spatial data, make
sure that the two types of data have a common level that you can use.
For example, ZIP code boundaries can cross not only county boundaries,
but also state boundaries, so there is usually not a one-to-one correspondence
between ZIP codes and states or counties. If the only information
that ties your attribute data to your spatial data is ZIP codes, you
will have difficulties using your ZIP code level attribute data if
you include only state or county boundaries in your spatial data.
For specific, smaller
areas of the country, a one-to-one correspondence might exist that
will enable you to summarize your attribute data to a higher level.
However, ZIP codes can change frequently, and this correspondence
might be lost. Also, because ZIP codes change, you must be able to
account for these changes when performing a historical analysis. For
example, if you are comparing sales in a specific ZIP code area over
a ten-year period, make sure that the area remained constant during
that period. The same is true for other spatial data.