| Creating Graphs |
Bar Charts
To create a bar chart, select Graphs ![]() Bar Chart. Select Horizontal ... or Vertical ... to create a horizontal or a vertical bar chart.
Bar Chart. Select Horizontal ... or Vertical ... to create a horizontal or a vertical bar chart.
 |
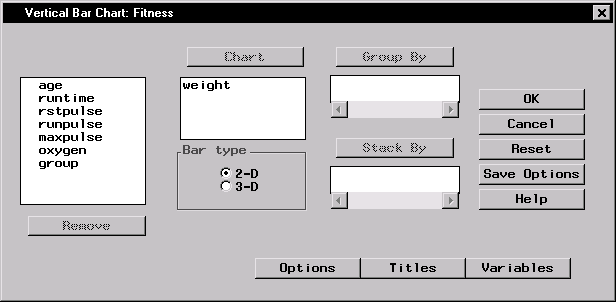
Figure 5.1: Vertical Bar Chart Dialog
Select variables from the candidate list and click on the Chart button to create bar charts of those variables.
Select 2-D or 3-D under Bar type to specify whether you want to display a two-dimensional or a three-dimensional chart.
Select a variable from the candidate list and click on the Group By button to add the variable to be used as a grouping variable in the bar chart. This organizes the bars into groups based on the values of the grouping variable.
Select a variable from the candidate list and click on the Stack By button to add the variable to be used as a stacking variable in the bar chart. Using a stacking variable subdivides, or stacks segments of, each bar based on the contribution of the stacking variable.
Bar Chart Options
Bar Chart Titles
Bar Chart Variables
Example: Create a 3-D Bar Chart
Copyright © 2007 by SAS Institute Inc., Cary, NC, USA. All rights reserved.