| Customizing Your Session |
Change Graph Settings
To change the point and line display color and the bar and contour rectangle pattern in your graphs, follow these steps:
- Select Tools
 Graph Settings ...
 - Select Color under Point display options.
- Select Magenta from the list of colors.
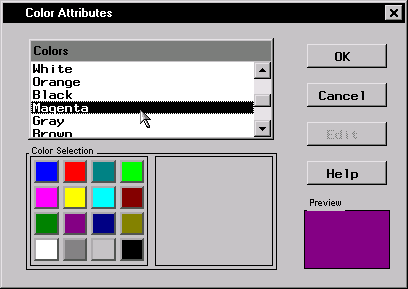
Figure 4.19: Select Point and Line Display Color
Click OK.
- Under the Bar and contour rectangle options heading, click on the arrow next to Pattern: and select Empty from the list of patterns.
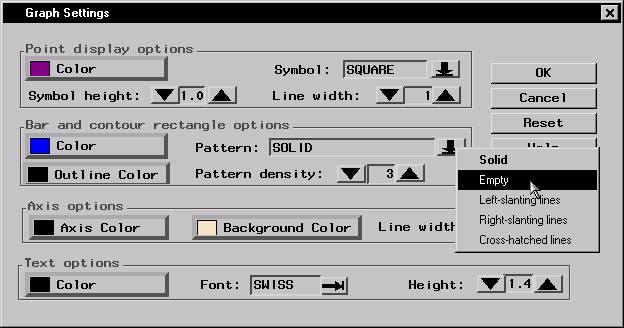
Figure 4.20: Select Bar and Contour Rectangle Pattern
- Click OK to save your graph settings.
Copyright © 2007 by SAS Institute Inc., Cary, NC, USA. All rights reserved.