| The Data Table |
Example: Modifying a Data Table
In this example, you combine selected columns from two data sets and edit them in a new data table. This example assumes that you have no data set loaded in the Analyst data table. If you do, select File ![]() New before starting the example.
New before starting the example.
Each data set contains the results of taste tests of breakfast cereal. Each cereal is rated by several judges, on a scale of 1 to 5. After you concatenate the two data sets, you split the rating column by sample number.
Open Data Sets for Editing
To select the data sets and bring them into a new Analyst data table, follow these steps:- Select Tools
 Sample Data ...
 - Select JRating1 and JRating2.
- Click OK to create the sample data sets in your Sasuser directory.
- Select Data Combine Tables Concatenate By Rows ...
- Click on the Open SAS Data button. Select Sasuser from the list of Libraries. Select Jrating1 from the list of members. Click OK.
- In the Concatenate Tables by Rows dialog, click on the Open SAS Data button again. Select Sasuser from the list of Libraries. Select Jrating2 from the list of members. Click OK.
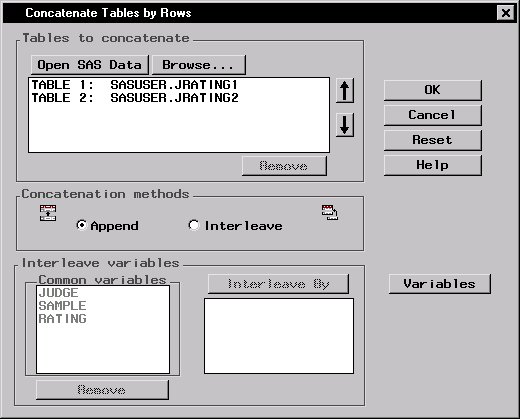
Figure 2.24: Concatenate Tables by Rows Dialog
- Select Interleave.
- Select JUDGE and SAMPLE from the list of Common variables and click on the Interleave By button to use JUDGE and SAMPLE as the variables by which the rows of the data tables will be combined.
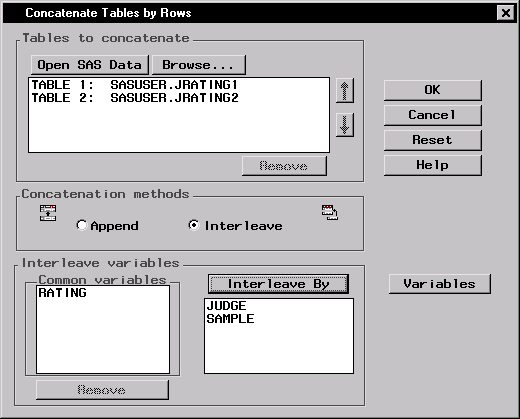
Figure 2.25: Interleave by Common Variables
- Click on the Variables button to select the columns to include in the new data table.
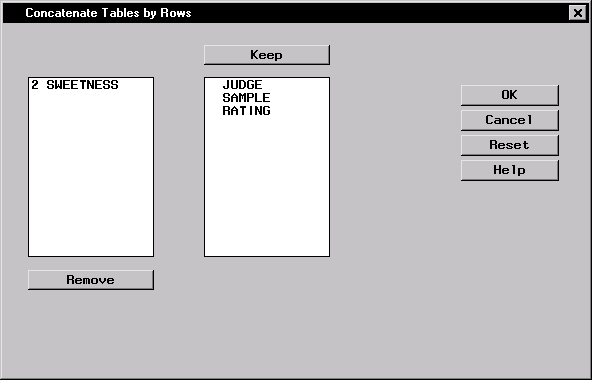
Figure 2.26: Selected Columns for New Data Table
Only those columns common to both data tables are kept by default, as shown in the Keep list. The column SWEETNESS is not kept as part of the resulting table. The number preceding the column name SWEETNESS represents the data table to which this variable belongs.
- Click OK to return to the Concatenate Tables by Rows dialog. Click OK again to display the new combined data table in a results window.
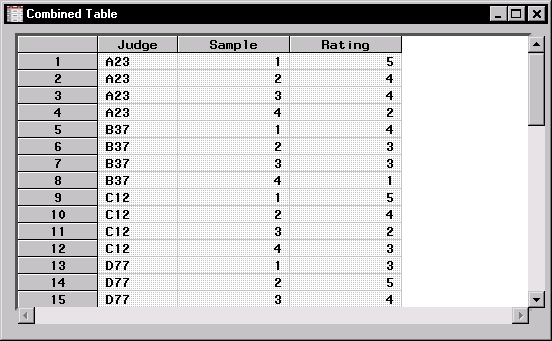
Figure 2.27: Combined Table
- To modify the combined table, you need to open it in the Analyst data table. Close the results window. Select the Combined Table node in the project tree and click the right mouse button to display the pop-up menu. Select Open.
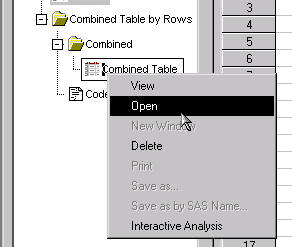
Figure 2.28: Opening the Combined Table
- By default, data tables are opened in Browse mode. Select Edit Mode Edit to change the mode from Browse to Edit.
Modify the Data
In the data table you can modify the data by splitting columns so that a new column is generated when the value of a variable changes. You can also subdivide data into ranges.To subdivide the data into ranges and split the columns according to sample number, follow these steps:
- Divide the taste test results into three categories: good, mediocre, and bad. Select Data Transform Recode Ranges ...
- Click on the arrow next to Column to recode: and select Rating. Type taste_test in the New column name: field. Change New column type: to Character. Type 3 in the Number of groups to be formed: field to designate three taste test ranges.
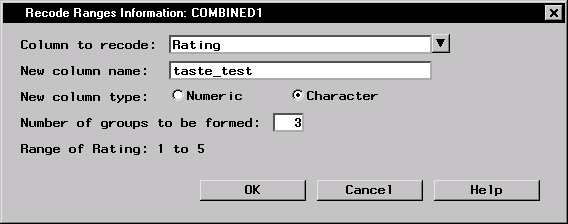
Figure 2.29: Recode Ranges Information Dialog
Click OK to specify the new ranges.
- In the first row, type 0 in the Lower Bound column and 2 in the Upper Bound column. Type bad in the New Value column.
- When you press the Enter key, the upper bound value of the previous row is automatically filled in as the lower bound of the current row. Type 3 in the Upper Bound column and mediocre in the New Value column.
- Move your cursor to the third row. Type 5 in the Upper Bound column and good in the New Value column.
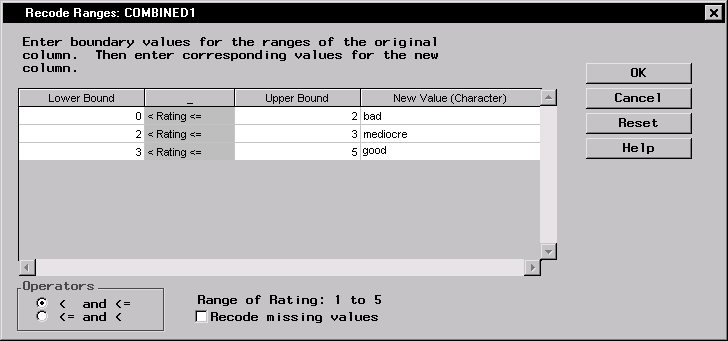
Figure 2.30: Boundary Values
- Click OK to save your new boundary values.
In the new table, the new ranges are displayed in the taste_test column.
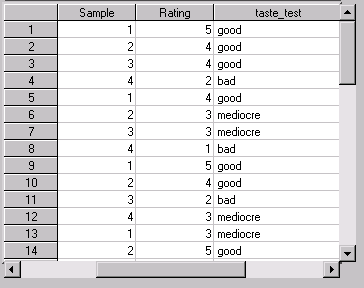
Figure 2.31: Table with taste_test Column
- Remove the Rating column by selecting the column and selecting Delete ... from the pop-up menu. Click OK in the Delete Items dialog.
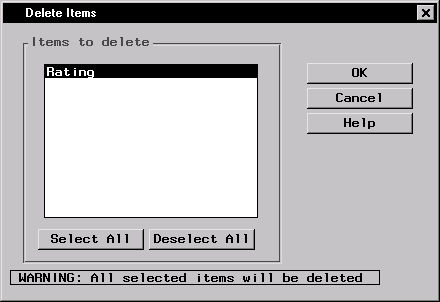
Figure 2.32: Delete Rating Column
- You are going to split the taste_test column by the Sample column so that a taste test for each sample is displayed by judge. Select Data Split Columns ...
- In the Split Columns dialog, select taste_test from the list and click on the Split Column button. Select Sample from the list and click on the Split By button.
- Select User-defined names for the column names. Type Sample_ in the Column name prefix: field.
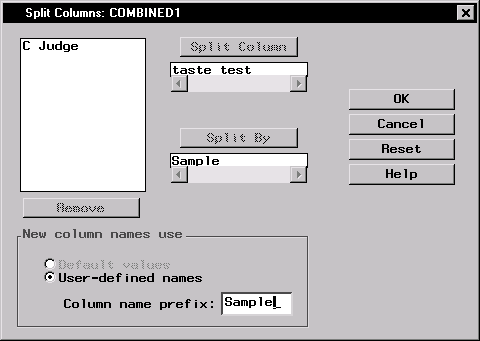
Figure 2.33: Taste_test Column Split by Sample
- Click OK. The resulting table displays the results of the taste test by each participating judge.
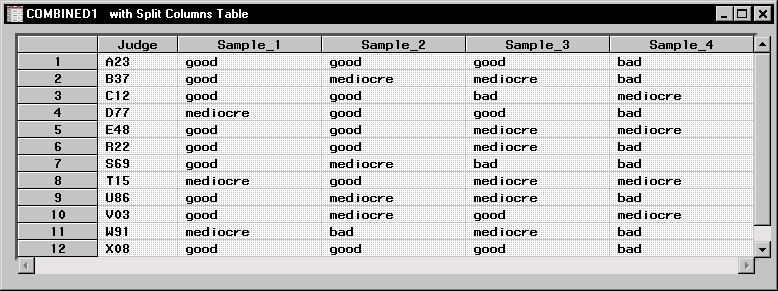
Figure 2.34: Split Columns Table
Copyright © 2007 by SAS Institute Inc., Cary, NC, USA. All rights reserved.